Fig. 7
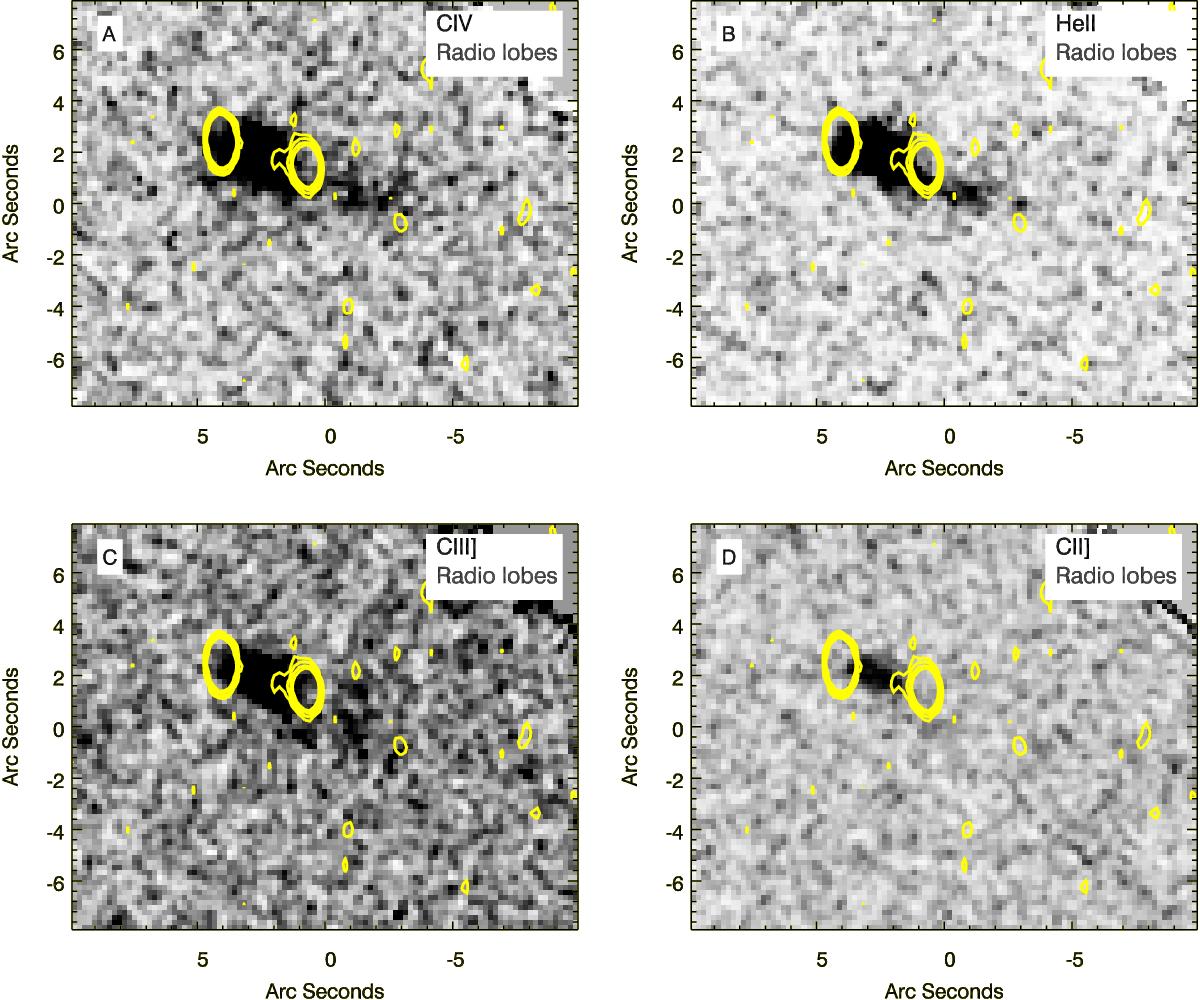
Continuum subtracted moment-0 maps of the CIV, HeII, CIII], and CII] emission lines. The continuum is determined from the nearby line free channels for each line. Panel A): sum over the CIV emission line for the wavelength range λobs = 6050−6090 Å. Panel B): sum over the HeII emission line for the wavelength range λobs = 6422−6430 Å and is the same image as the blue colour of the middle panel of Fig. 5. Panel C): sum over the CIII] emission line for the wavelength range λobs = 7455−7485 Å. Panel D): sum over the CII] emission line for the wavelength range λobs = 9071−9171 Å. Over-plotted with yellow contours in all panels is the VLA radio map, as a reference.
Current usage metrics show cumulative count of Article Views (full-text article views including HTML views, PDF and ePub downloads, according to the available data) and Abstracts Views on Vision4Press platform.
Data correspond to usage on the plateform after 2015. The current usage metrics is available 48-96 hours after online publication and is updated daily on week days.
Initial download of the metrics may take a while.