Fig. 5
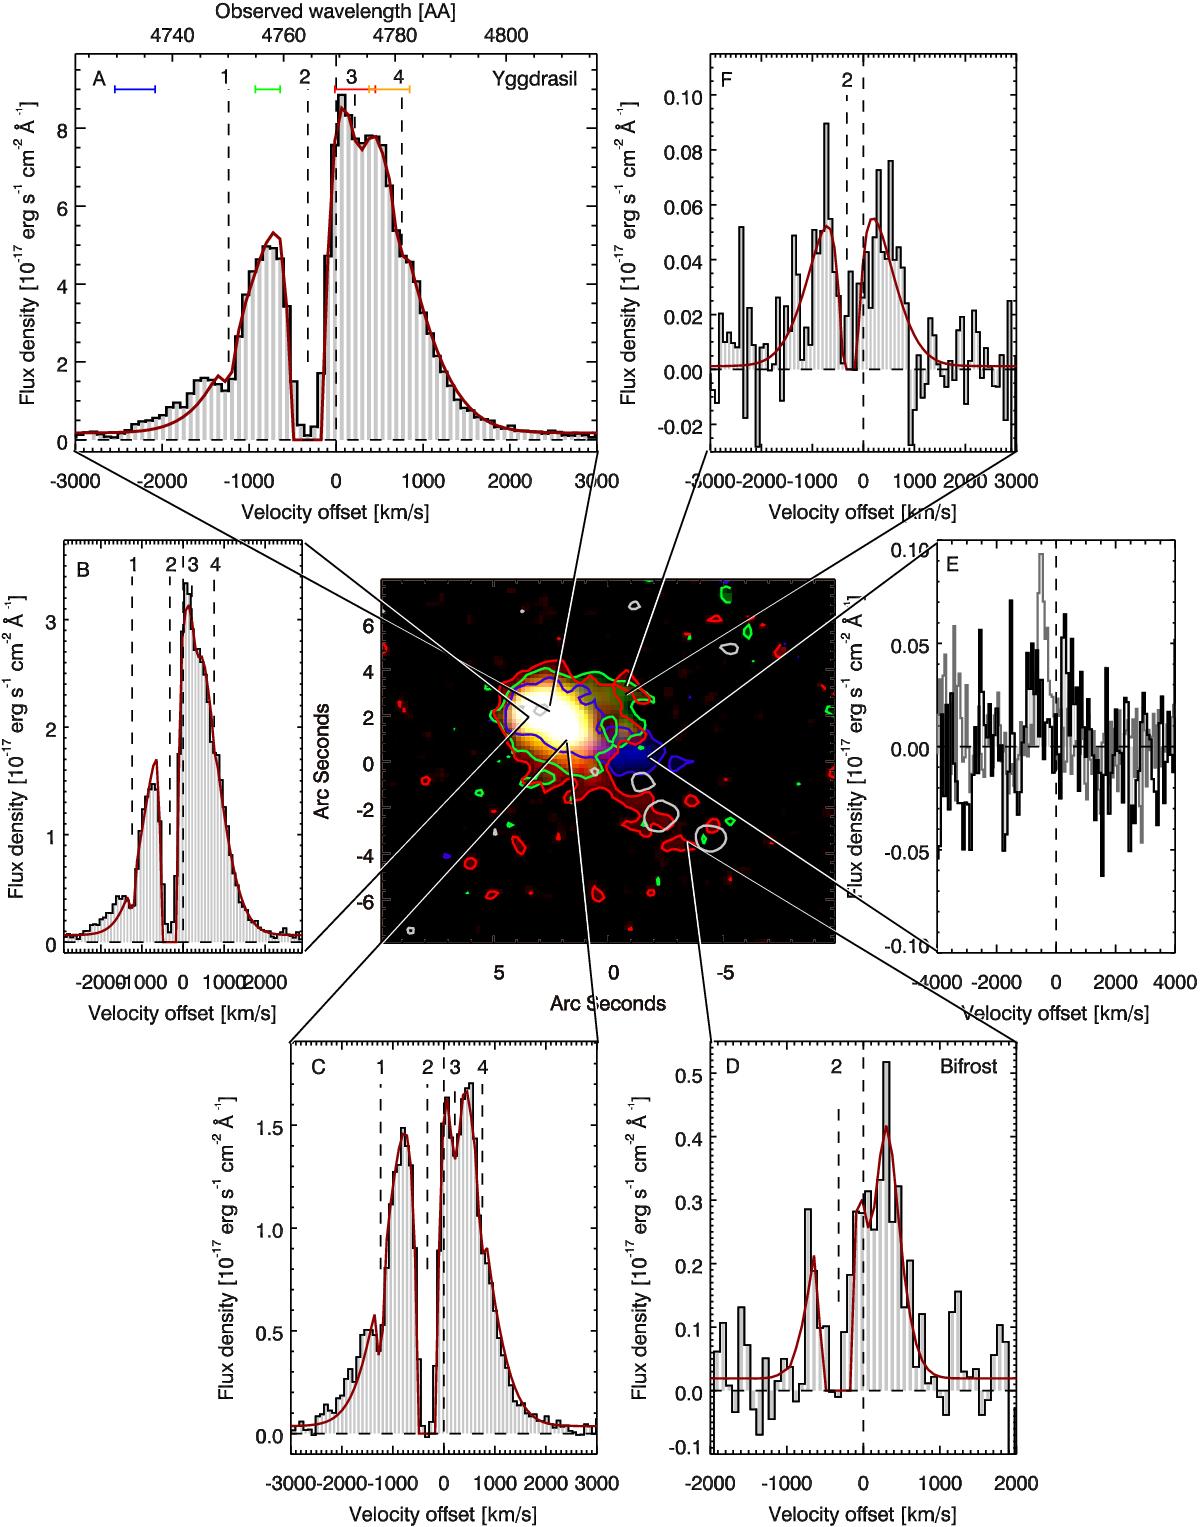
Overview of emission and absorption components at different positions around MRC0943-242. Middle Panel: composite red-green-blue image of Lyα and HeII emission (see caption of Fig. 1 for more details) with the ALMA 235 GHz contours overlaid in grey. Panel A): the Lyα line profile of the full area of Yggdrasil (elliptical aperture of 1.3″ × 0.7″), showing all four absorption components. Component 2 is the most prominent and goes to zero intensity at its centre. The spectrum has an rms of 0.3 × 10⁻¹⁷ erg s-1 cm-2Å-1. The blue, green, red, and orange bars above the spectrum shows the range in wavelength the channelmaps in Fig. 6 have been summed over. The blue correspond to panel A), green to panel B), red to panel C), and orange to panel C) in Fig. 6. Panels B) and C): the Lyα profiles of two areas near the nucleus (circular 0.5″ apertures) and have rms of 0.1 × 10⁻¹⁷ erg s-1 cm-2Å-1. These profiles likewise show signs of all four absorption components. Panel D): the Lyα profile of Bifrost (circular 1.2″ aperture and rms of 0.1 × 10⁻¹⁷ erg s-1) showing sign of absorption component 2. Panel E): spectrum extracted at the HeII emitting tail (0.7″ aperture), showing no sign of Lyα emission and an rms of 0.02 × 10⁻¹⁷ erg s-1 cm-2Å-1. The HeII lines is over-plotted in grey. Panel F): the Lyα profile of the western extended Lyα emitting gas (0.4″ aperture). All Lyα velocity profiles have been fitted with Voigt profiles superimposed on a Gaussian profile. These fits are shown as the red curves over plotted on the spectra.
Current usage metrics show cumulative count of Article Views (full-text article views including HTML views, PDF and ePub downloads, according to the available data) and Abstracts Views on Vision4Press platform.
Data correspond to usage on the plateform after 2015. The current usage metrics is available 48-96 hours after online publication and is updated daily on week days.
Initial download of the metrics may take a while.