Fig. 9
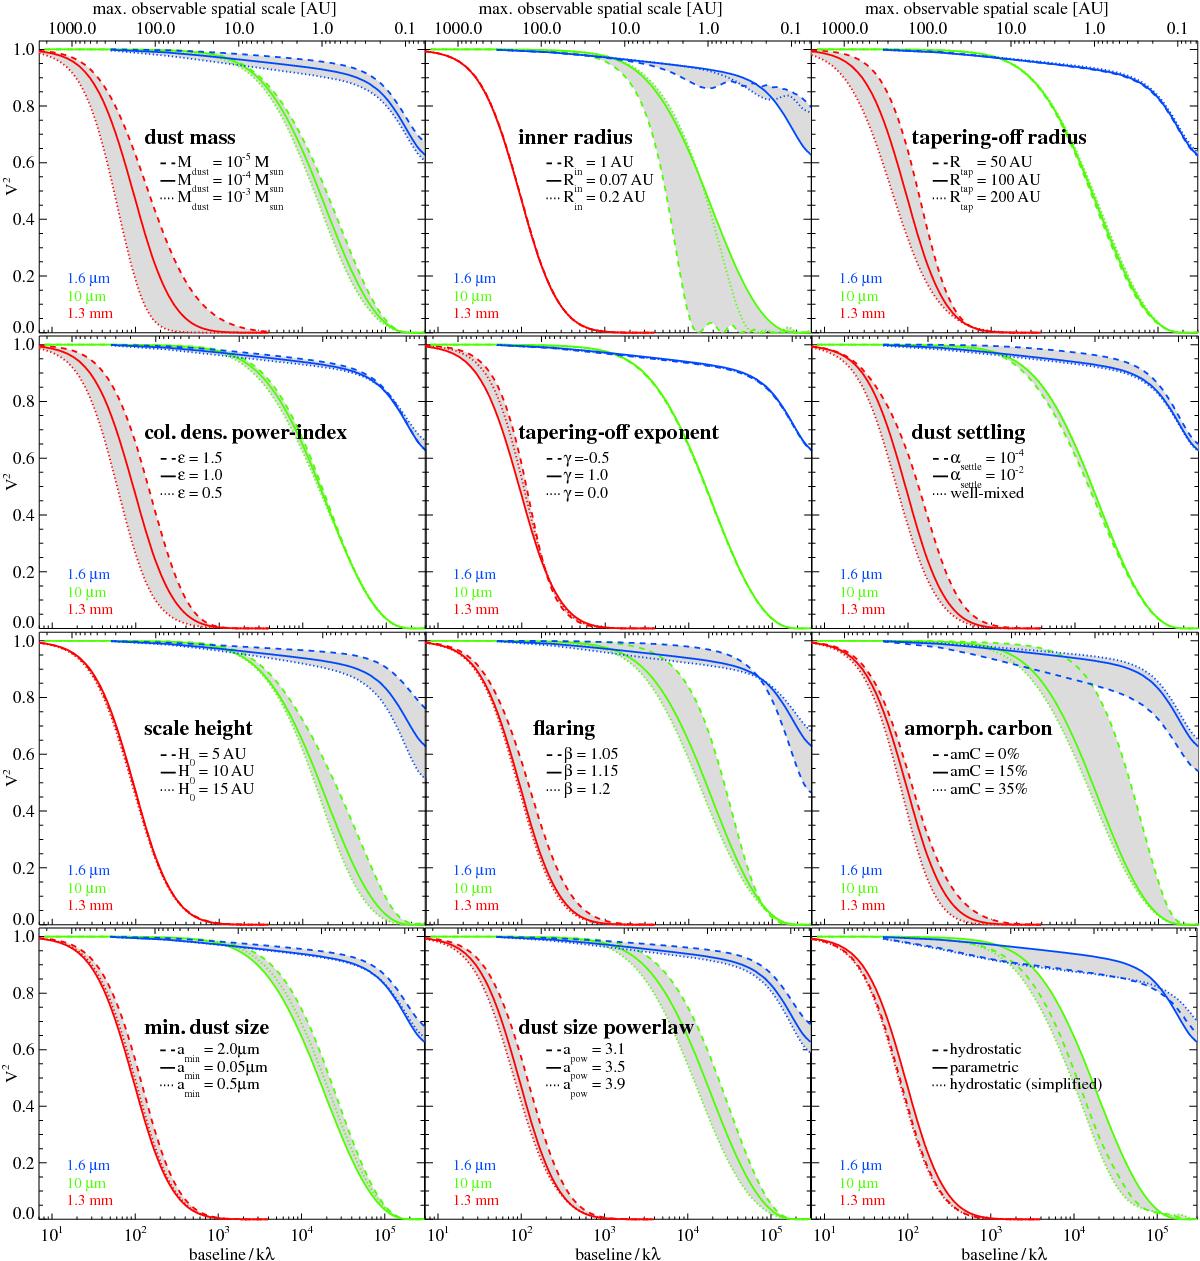
Effects of selected dust and disk shape parameters on continuum visibilities at 1.6 μm (blue), 10 μm (green) and 1.3 mm (red). Distance is 140 pc. The squared visibility V2 (fraction of correlated flux) is shown as function of baseline [cm] /1000 /λ [cm] for baseline orientation along the major axis of the disk on the sky. The abscissa on top is the corresponding maximum observable spatial scale [cm] = 0.6·d [cm] /baseline [kλ] /1000. The full lines show the reference model, identical in every part figure. The dashed and dotted lines correspond to the changed parameter values as annotated. Non-depicted parameters have less influence on the visibilities, for example amax. See Table 3 for explanations of parameter symbols.
Current usage metrics show cumulative count of Article Views (full-text article views including HTML views, PDF and ePub downloads, according to the available data) and Abstracts Views on Vision4Press platform.
Data correspond to usage on the plateform after 2015. The current usage metrics is available 48-96 hours after online publication and is updated daily on week days.
Initial download of the metrics may take a while.