Fig. 4
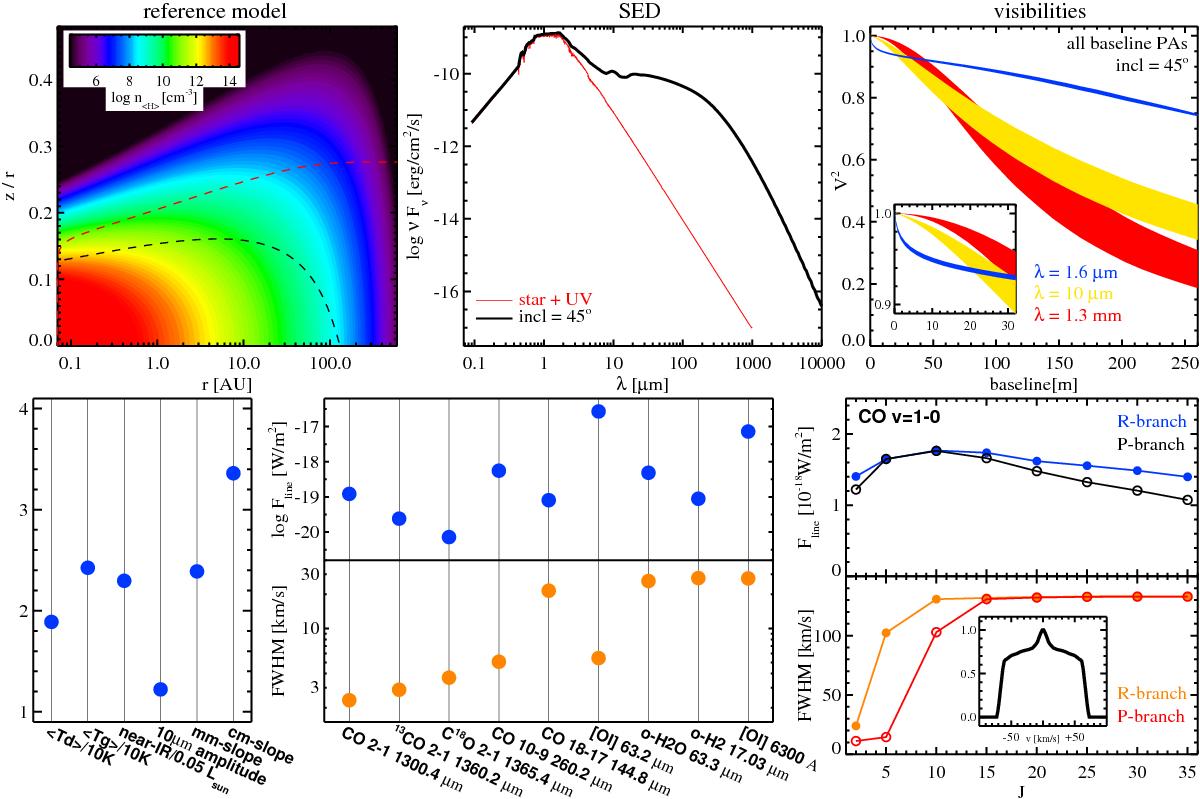
Summary of results from the reference model. Top row: assumed gas density structure n⟨ H ⟩(r,z) with overplotted radial (red) and vertical (black) optical depths AV = 1 dashed contours, computed SED, and visibilities. In the visibility plot, the coloured areas show V2 for all baseline orientations at 3 different wavelengths, with a zoom-in on the first 30 m. Lower row: other resulting quantities. The left plot shows the mean dust and gas temperatures (in units of 10 K), the near-IR excess (in units of 0.05 L⊙) and the logarithmic SED slopes at mm and cm wavelengths. The centre plot shows calculated line fluxes and full widths at half maximum (FWHM). The right plot shows some results for the CO fundamental ro-vibrational line emissions, line fluxes as function of rotational quantum number J for the R-branch and the P-branch, as well as computed FWHM for those lines. The inserted figure shows the line profile averaged over all emission lines, scaled from 0 (continuum) to 1 (maximum).
Current usage metrics show cumulative count of Article Views (full-text article views including HTML views, PDF and ePub downloads, according to the available data) and Abstracts Views on Vision4Press platform.
Data correspond to usage on the plateform after 2015. The current usage metrics is available 48-96 hours after online publication and is updated daily on week days.
Initial download of the metrics may take a while.