Fig. G.2
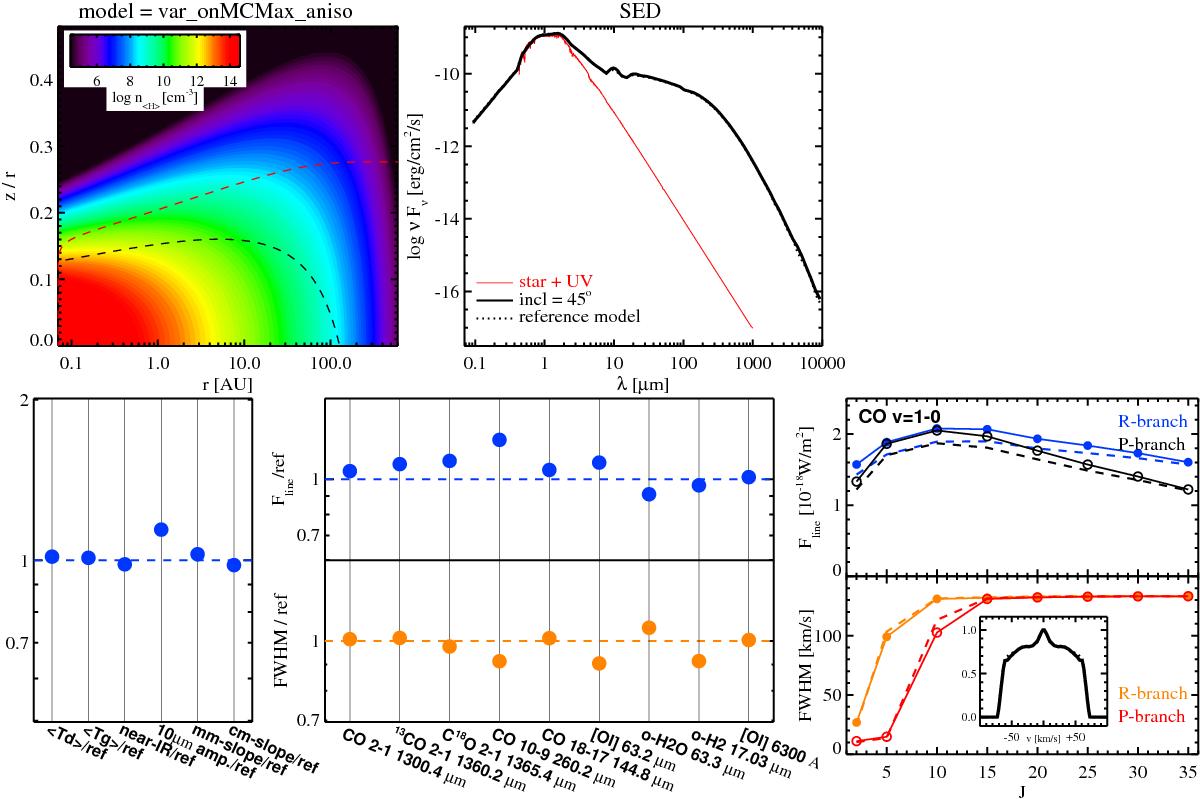
Comparison of results between models using isotropic and anisotropic scattering. Both models are MCMax→ProDiMo chain models. The results from the anisotropic model are shown with respect to the results obtained from the isotropic (reference) model. Depicted quantities are explained in Fig 4. The visibility plot is omitted here.
Current usage metrics show cumulative count of Article Views (full-text article views including HTML views, PDF and ePub downloads, according to the available data) and Abstracts Views on Vision4Press platform.
Data correspond to usage on the plateform after 2015. The current usage metrics is available 48-96 hours after online publication and is updated daily on week days.
Initial download of the metrics may take a while.