Fig. 3
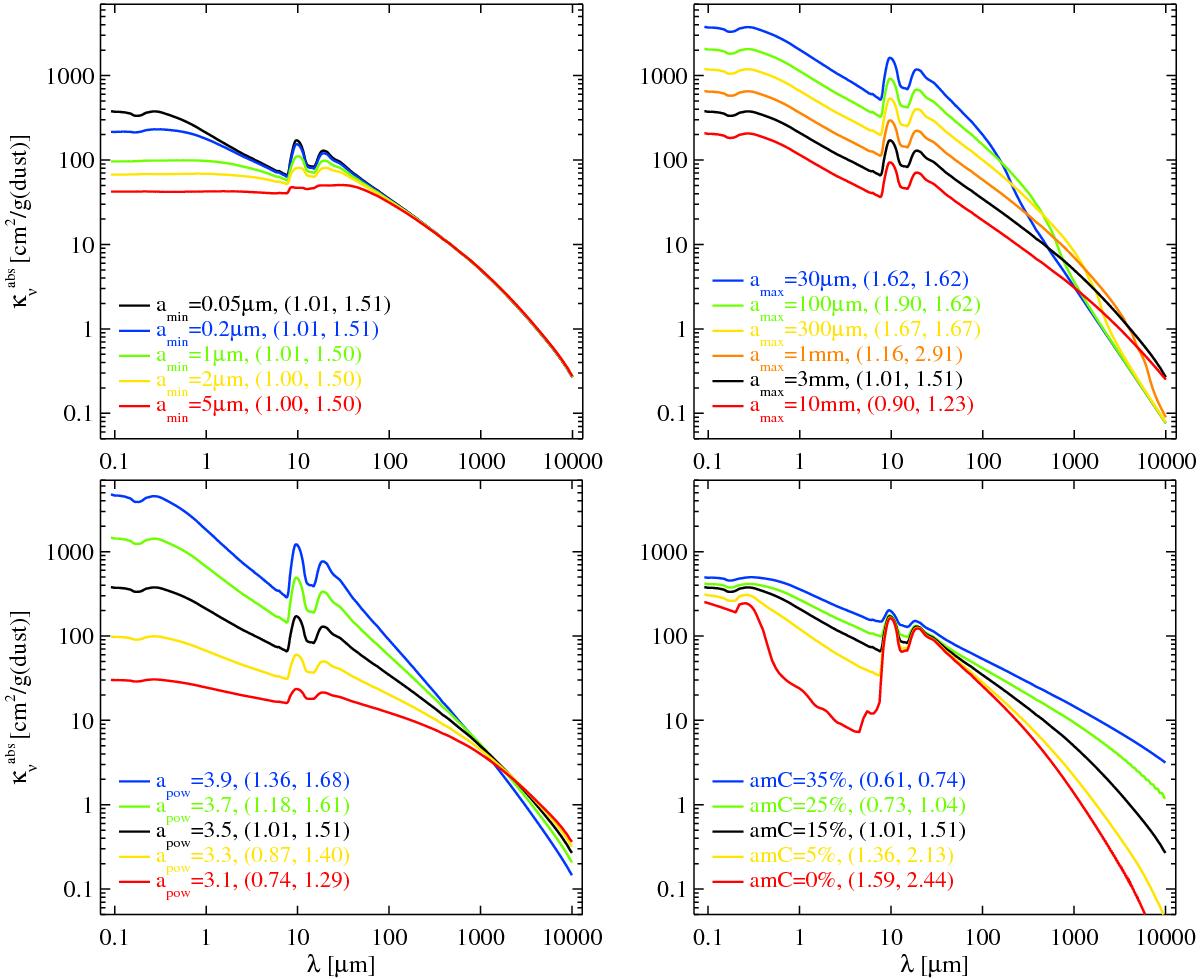
Dust absorption coefficient per dust mass as function of dust size and material parameters. The black line is identical in every part plot, with parameter values as used in the reference model, our dust standard opacities, see Table 3. The upper two figures show the dependencies on minimum and maximum particle size, amin and amax. The lower two plots show the dependencies on dust size powerlaw index apow and on the volume fraction of amorphous carbon. 25% porosity and maximum hollow volume ratio ![]() are assumed throughout. The two numbers in brackets represent the log-log dust absorption opacity slopes between 0.85 mm and 1.3mm, and between 5 mm and 1 cm, see Appendix D.
are assumed throughout. The two numbers in brackets represent the log-log dust absorption opacity slopes between 0.85 mm and 1.3mm, and between 5 mm and 1 cm, see Appendix D.
Current usage metrics show cumulative count of Article Views (full-text article views including HTML views, PDF and ePub downloads, according to the available data) and Abstracts Views on Vision4Press platform.
Data correspond to usage on the plateform after 2015. The current usage metrics is available 48-96 hours after online publication and is updated daily on week days.
Initial download of the metrics may take a while.