Fig. G.1
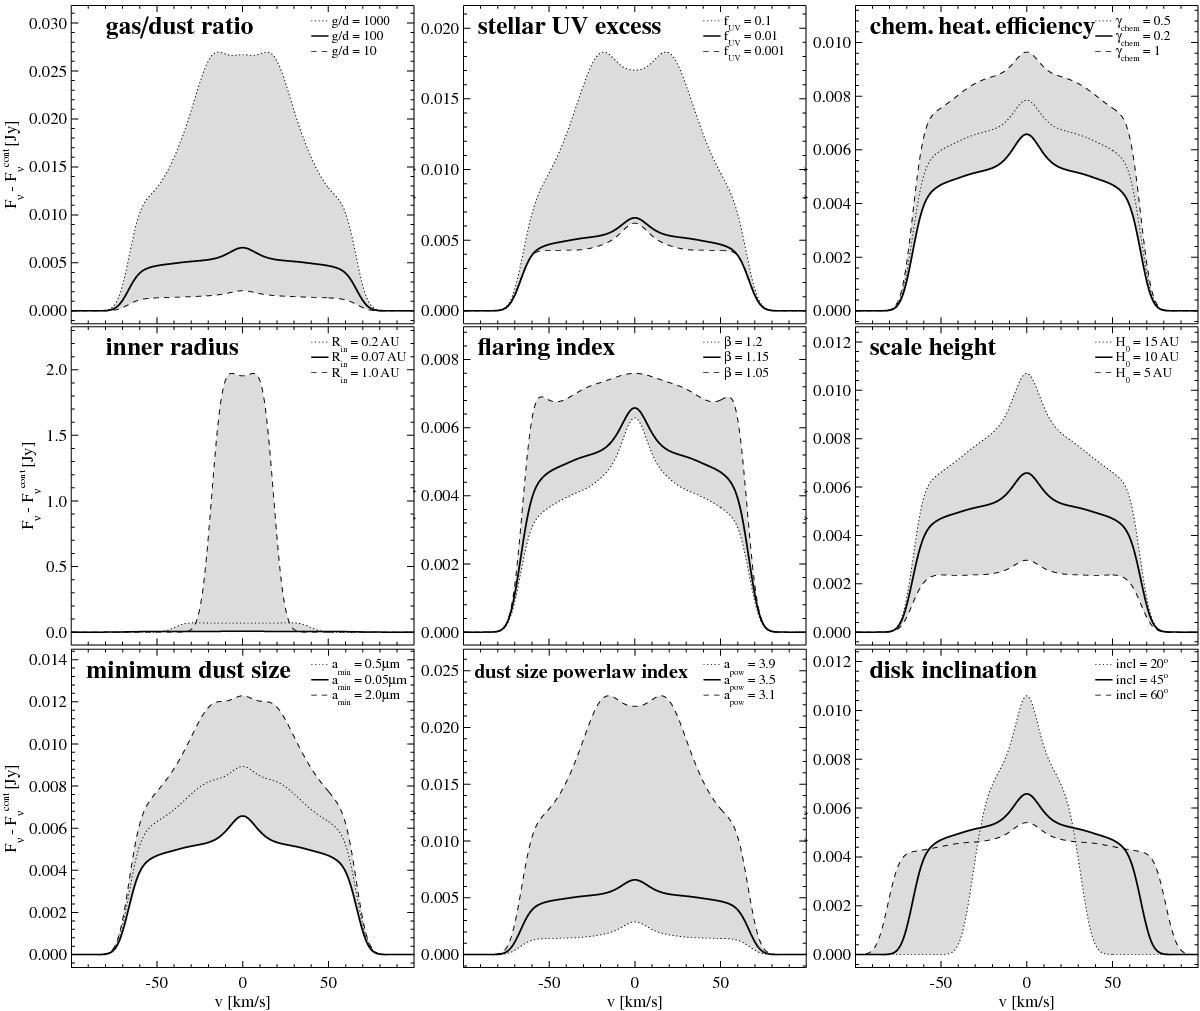
Effects of selected stellar, gas, dust and disk shape parameters on CO fundamental emission line profiles. Each part figure shows mean line profiles averaged over all computed CO υ = 1 → 0R-branch and P-branch emission lines, continuum subtracted and convolved with a 12 km s-1 Gaussian (resolution R ≈ 25 000). The thick full lines show the reference model, identical in every part figure. The shaded areas indicate the changes caused by single parameter variations, where the dashed and dotted lines correspond to the changed parameter values as annotated. Non-depicted parameters have less influence on the CO fundamental emission, for example the X-ray luminosity LX, compare Fig. 18.
Current usage metrics show cumulative count of Article Views (full-text article views including HTML views, PDF and ePub downloads, according to the available data) and Abstracts Views on Vision4Press platform.
Data correspond to usage on the plateform after 2015. The current usage metrics is available 48-96 hours after online publication and is updated daily on week days.
Initial download of the metrics may take a while.