Fig. B.1
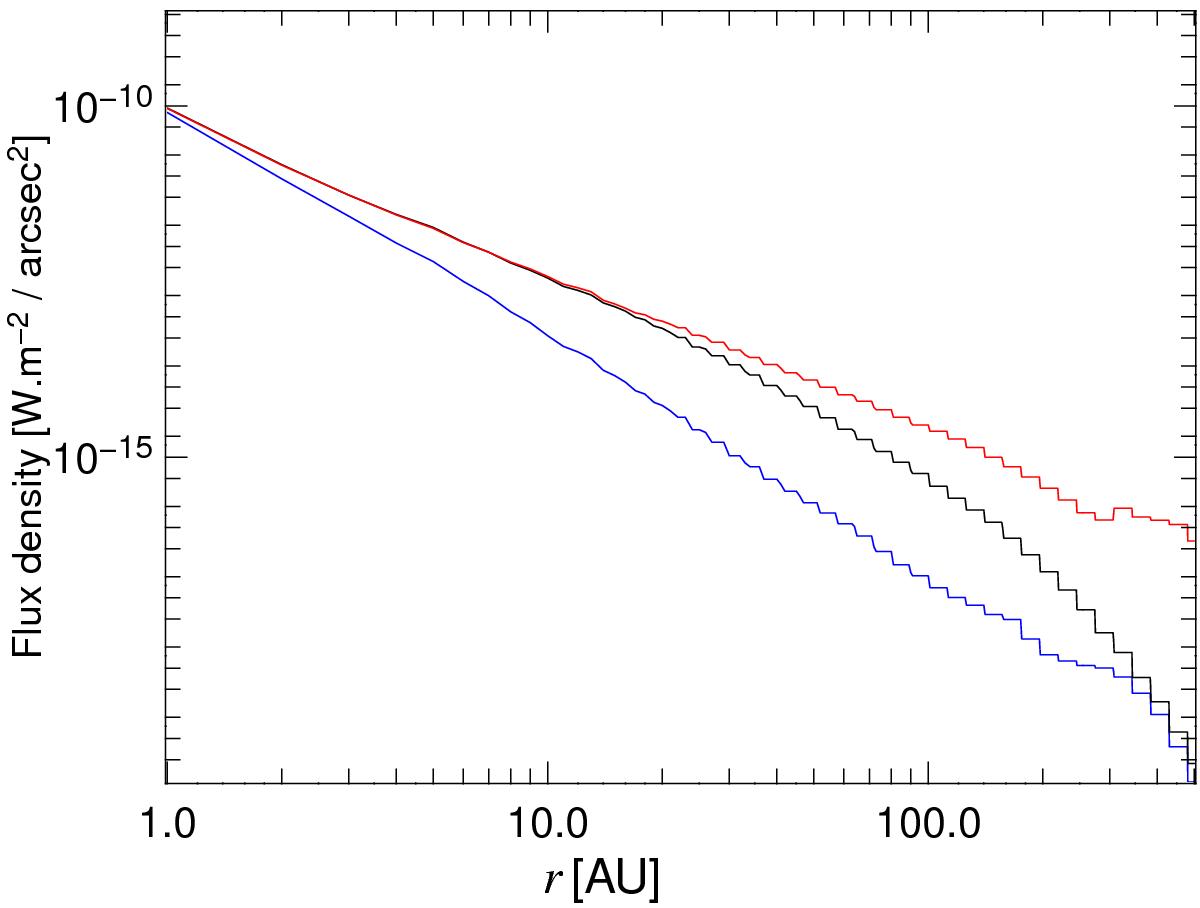
Comparison of radial intensity profiles in the 11.3 μm PAH emission feature obtained from the reference T Tauri model. The blue lines shows the intensity profile if dust and PAHs are assumed to have a common radiative equilibrium temperature. The black line shows the simplified treatment with independent dust and PAH temperatures, both in radiative equilibrium. The red line shows the results obtained with the full PAH treatment with a stochastic PAH temperature distribution.
Current usage metrics show cumulative count of Article Views (full-text article views including HTML views, PDF and ePub downloads, according to the available data) and Abstracts Views on Vision4Press platform.
Data correspond to usage on the plateform after 2015. The current usage metrics is available 48-96 hours after online publication and is updated daily on week days.
Initial download of the metrics may take a while.