Fig. A.2
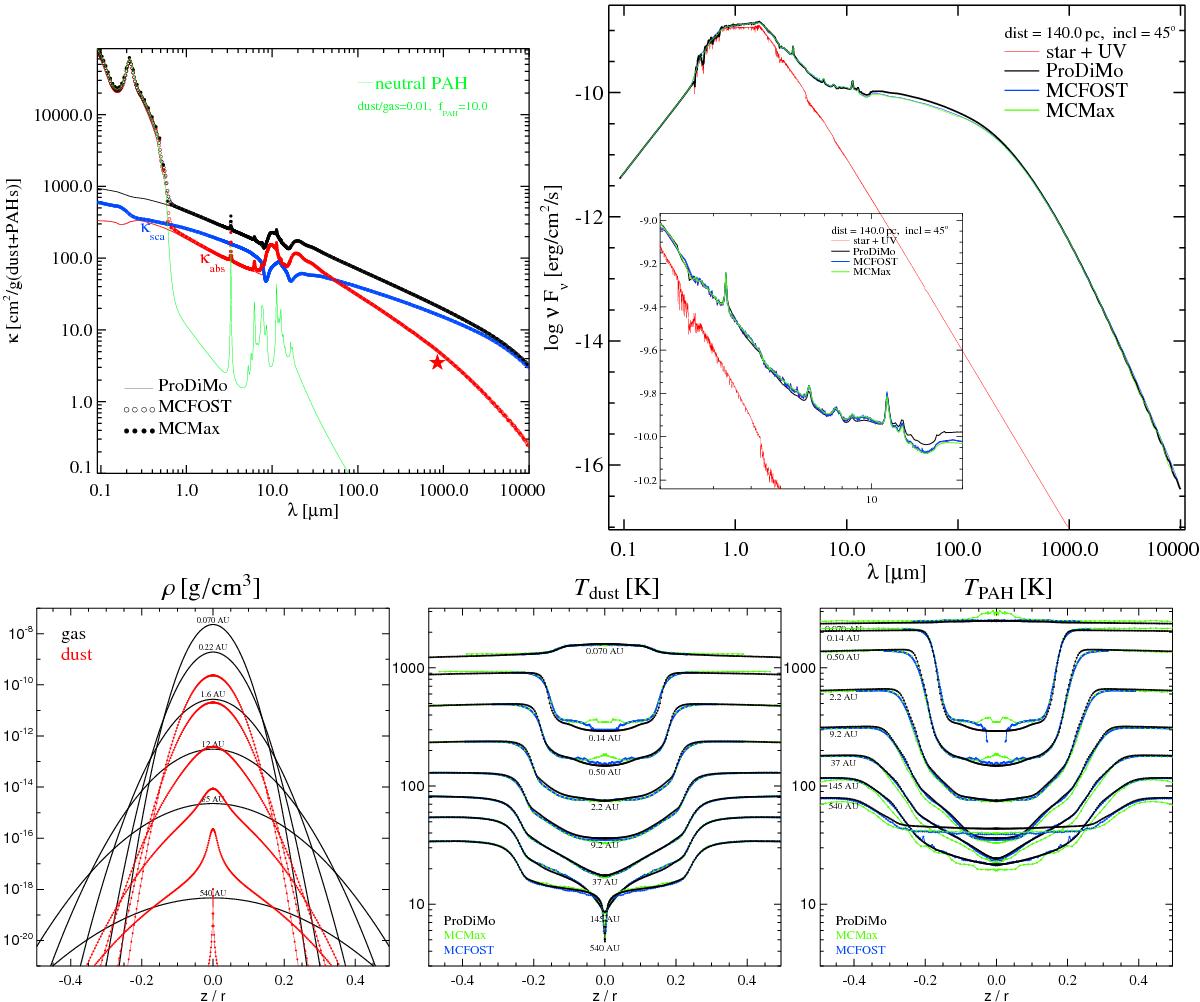
Results for the T Tauri reference model with artificially large PAH abundance (fPAH = 10), showing independent results from ProDiMo, MCMax and MCFOST with PAHs in radiative equilibrium. The upper left figure shows the well-mixed dust and neutral PAH opacities. ProDiMo opacities are shown by lines, separately for dust (black = extinction, red = absorption, blue = scattering) and PAHs (green, only absorption), MCMax and MCFOST opacities are shown by dots (combined dust+PAH opacities). The upper right figure shows the computed SEDs with a zoom-in on the prominent PAH emission features at 3.3 μm, 6.2 μm, 7.6 μm, 8.6 μm, 11.3 μm and 13.5 μm. The lower left plot shows the assumed gas densities ρgas (black) and derived (settled) dust densities ρdust (red) for a series of vertical cuts at radius r as labelled. The PAH densities are given by ρPAH ≈ 0.00132 × ρgas for fPAH = 10. The lower middle and lower right plots compare the computed dust and PAH temperatures betweenMCMax (green), MCFOST (blue), and ProDiMo (black).
Current usage metrics show cumulative count of Article Views (full-text article views including HTML views, PDF and ePub downloads, according to the available data) and Abstracts Views on Vision4Press platform.
Data correspond to usage on the plateform after 2015. The current usage metrics is available 48-96 hours after online publication and is updated daily on week days.
Initial download of the metrics may take a while.