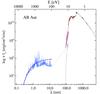
Fig. A.1
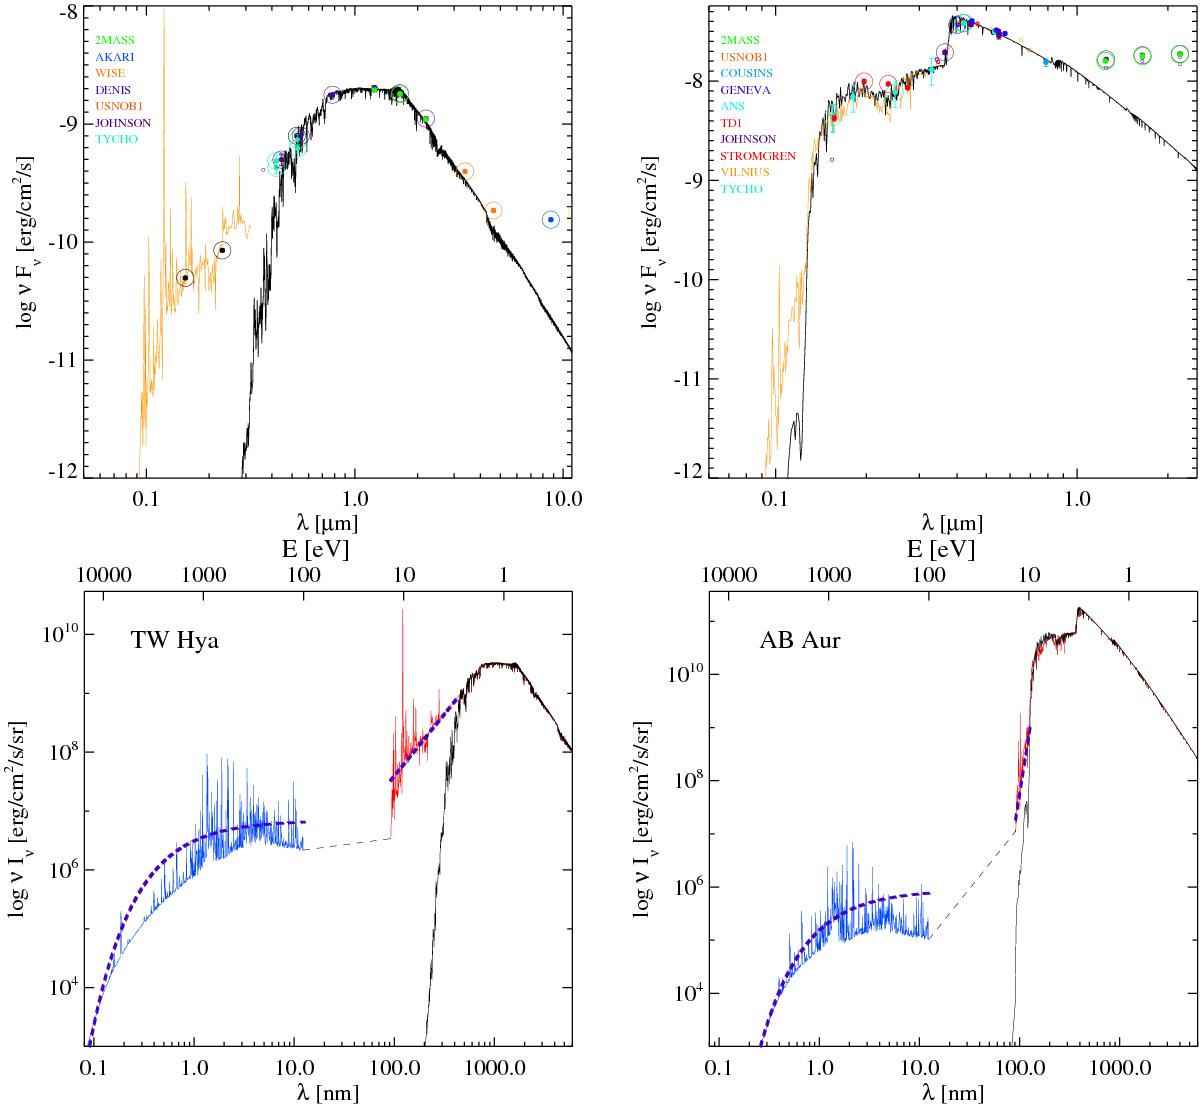
Fitting stellar parameters, and compilation of the stellar irradiation for two examples, TW Hya (left) and AB Aur (right). The upper plots show measured photometric fluxes (coloured symbols) as function of wavelength λ, in comparison to our best fitting, reddened Phoenix stellar atmosphere model spectrum (black), and the averaged observed FUV data (orange). The lower plots show the de-reddened surface intensities Iν(r = R⋆) (black), and the averaged, de-reddened FUV data (λ> 91.2 nm, red). The blue lines show fits to de-absorbed X-ray data, using a two-component X-ray gas emission model (energy E> 0.1 keV). The dashed grey line marks the EUV regime in between, which is assumed to be absorbed by neutral hydrogen between the star and the disk and hence disregarded in the disk model. The dashed magenta lines show quick parametric fits to the UV and X-ray data, see Eqs. (A.1) and (A.2) and text, not used for the TW Hya and AB Aur models.
Current usage metrics show cumulative count of Article Views (full-text article views including HTML views, PDF and ePub downloads, according to the available data) and Abstracts Views on Vision4Press platform.
Data correspond to usage on the plateform after 2015. The current usage metrics is available 48-96 hours after online publication and is updated daily on week days.
Initial download of the metrics may take a while.