Fig. 20
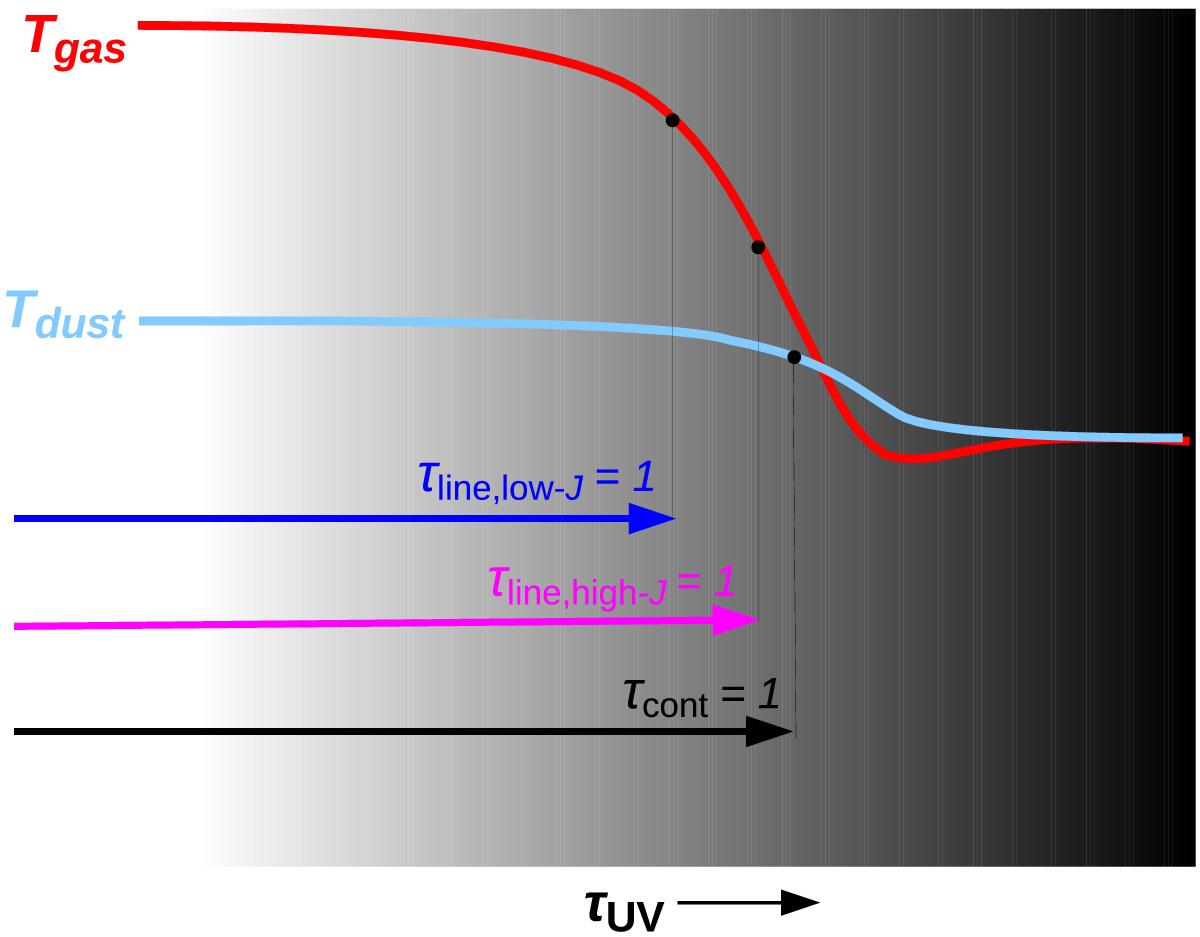
Understanding optically thick CO ro-vibrational emission lines. The sketch can either represent the inner rim horizontally, or a distant disk column vertically. The gas and dust temperature structure is connected to τUV, the dust optical depth in the UV. High-J and low-J CO emission lines have different line optical depths, so their fluxes probe the contrast between gas and dust temperatures at different depths.
Current usage metrics show cumulative count of Article Views (full-text article views including HTML views, PDF and ePub downloads, according to the available data) and Abstracts Views on Vision4Press platform.
Data correspond to usage on the plateform after 2015. The current usage metrics is available 48-96 hours after online publication and is updated daily on week days.
Initial download of the metrics may take a while.