Fig. 18
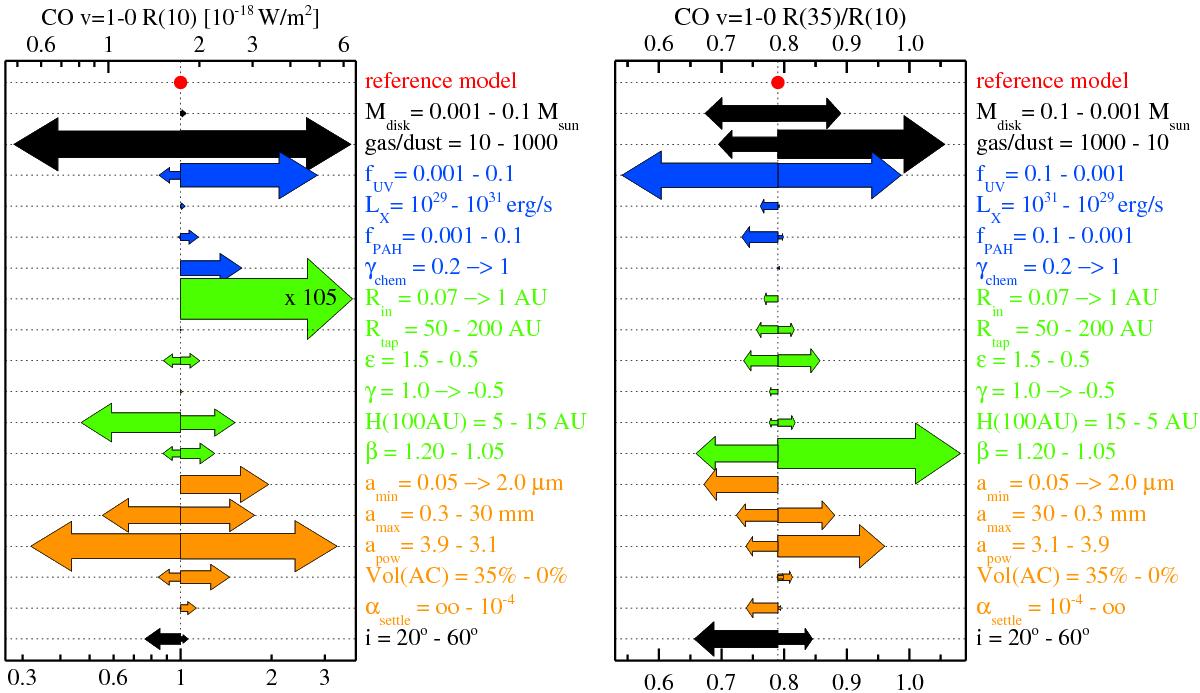
Impact of model parameters on ro-vibrational CO emission. On the l.h.s, the υ = 1 → 0R(10) line has been selected to study the effects of changing model parameters on line flux. The r.h.s. shows the R(35) /R(10) line ratio, a measure for the “CO rotational excitation temperature”. Large line ratios indicate emission from hot CO. Note that the direction of parameter impact is often reversed on the r.h.s., i.e. weak lines are usually emitted from a tiny area of hot gas, whereas strong lines are emitted from an extended area of cool gas. See Fig. 10 for further explanations.
Current usage metrics show cumulative count of Article Views (full-text article views including HTML views, PDF and ePub downloads, according to the available data) and Abstracts Views on Vision4Press platform.
Data correspond to usage on the plateform after 2015. The current usage metrics is available 48-96 hours after online publication and is updated daily on week days.
Initial download of the metrics may take a while.