Free Access
Fig. 17
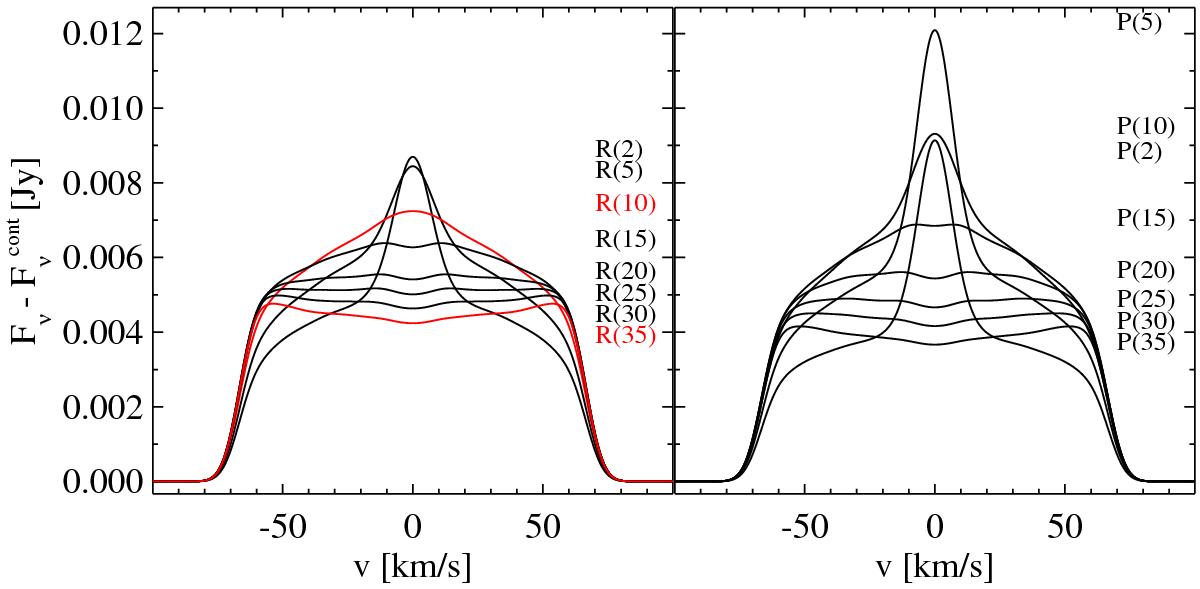
CO υ = 1 → 0 line velocity profiles predicted by the reference model, continuum subtracted and convolved with a 12 km s-1 Gaussian (resolution R ≈ 25 000). The R(10) and R(35) lines plotted in red are selected for further study of the model parameters impacts in Fig. 18.
Current usage metrics show cumulative count of Article Views (full-text article views including HTML views, PDF and ePub downloads, according to the available data) and Abstracts Views on Vision4Press platform.
Data correspond to usage on the plateform after 2015. The current usage metrics is available 48-96 hours after online publication and is updated daily on week days.
Initial download of the metrics may take a while.