Fig. 15
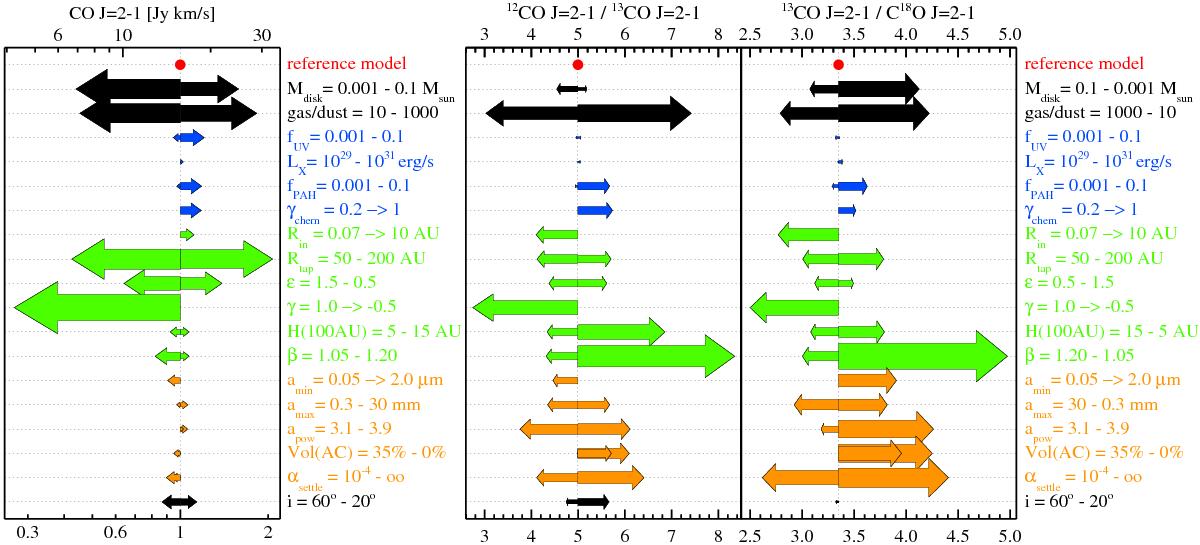
Predicted behaviour of the 12CO, 13CO and C18O J = 2 → 1 isotopologue lines around 1.3 mm. The left plot shows the impact of model parameters on the predicted 12CO line flux, see Fig. 10 for more explanations. The two figures on the right show the impacts of model parameters on the 12CO /13CO and 13CO/C18O line ratios. Note that the direction of effects is sometimes inversed on the r.h.s., for example the dependency on disk flaring parameter β. Less flaring leeds to weaker CO lines in general, but to larger line ratios. On the right, both an increase and a decrease of the amorphous carbon dust volume fraction Vol(AC) lead to higher line ratios, here the larger arrows correspond to Vol(AC) = 0%.
Current usage metrics show cumulative count of Article Views (full-text article views including HTML views, PDF and ePub downloads, according to the available data) and Abstracts Views on Vision4Press platform.
Data correspond to usage on the plateform after 2015. The current usage metrics is available 48-96 hours after online publication and is updated daily on week days.
Initial download of the metrics may take a while.