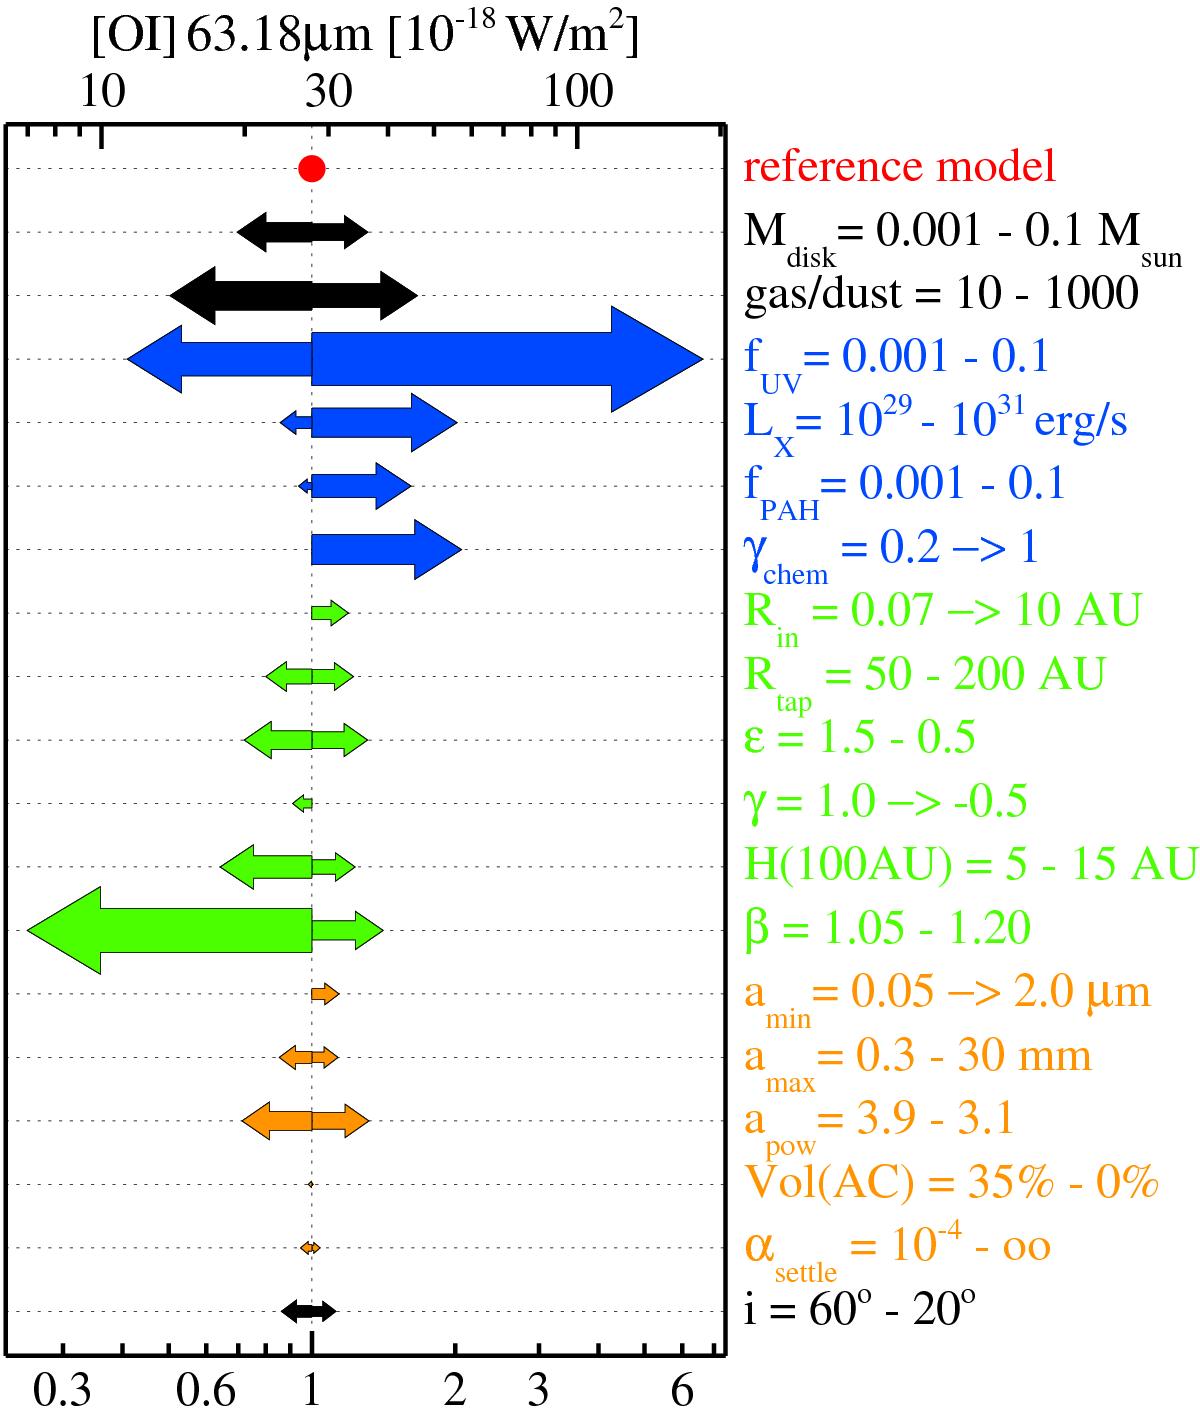
Fig. 13

“Impactogram” of the [OI] 63.2 μm emission line. The absolute line flux is depicted on the top abscissa, as well as relative to the reference model at the bottom. Leftward arrows indicate a weakening of the line, and rightward arrows a strengthening of the line, due to changes of single model parameter as indicated on the r.h.s. The colours indicate groups of parameters. Gas and dust masses are shown in black, heating parameters in blue, disk shape parameters in green, and dust parameters in orange. See Fig. 10 for further explanations.
Current usage metrics show cumulative count of Article Views (full-text article views including HTML views, PDF and ePub downloads, according to the available data) and Abstracts Views on Vision4Press platform.
Data correspond to usage on the plateform after 2015. The current usage metrics is available 48-96 hours after online publication and is updated daily on week days.
Initial download of the metrics may take a while.


