Fig. 12
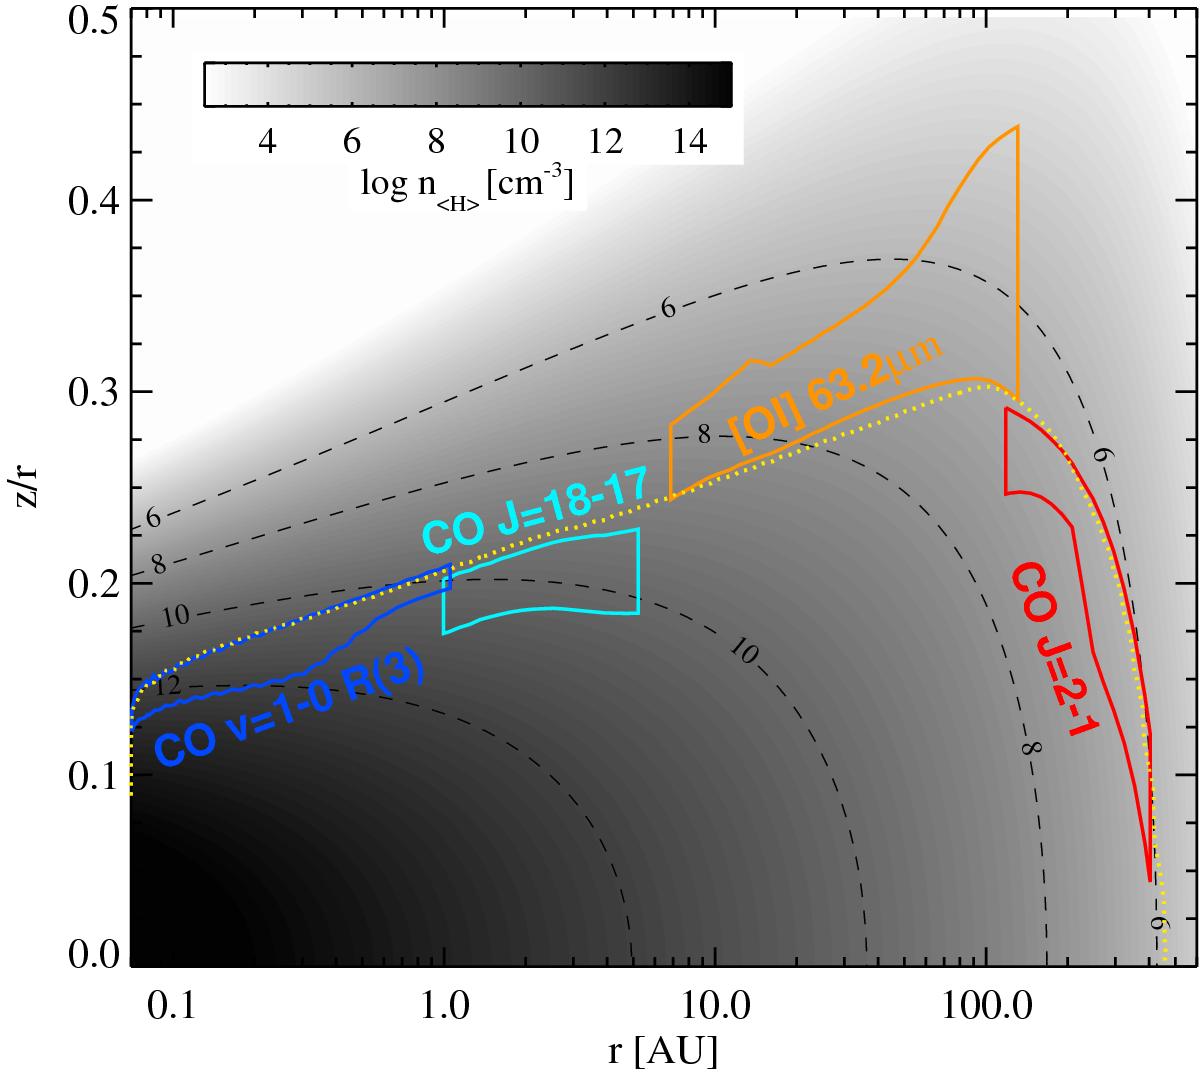
Line emitting regions in the reference model. The surrounded areas are responsible for 50% of the vertically emitted line fluxes as annotated. The black dashed contours show the hydrogen nuclei particle density log n⟨ H ⟩(r,z). The yellow dotted contour line shows the upper boundary of the molecular layer where nCO/n⟨ H ⟩ = 10-5.
Current usage metrics show cumulative count of Article Views (full-text article views including HTML views, PDF and ePub downloads, according to the available data) and Abstracts Views on Vision4Press platform.
Data correspond to usage on the plateform after 2015. The current usage metrics is available 48-96 hours after online publication and is updated daily on week days.
Initial download of the metrics may take a while.