Fig. 10
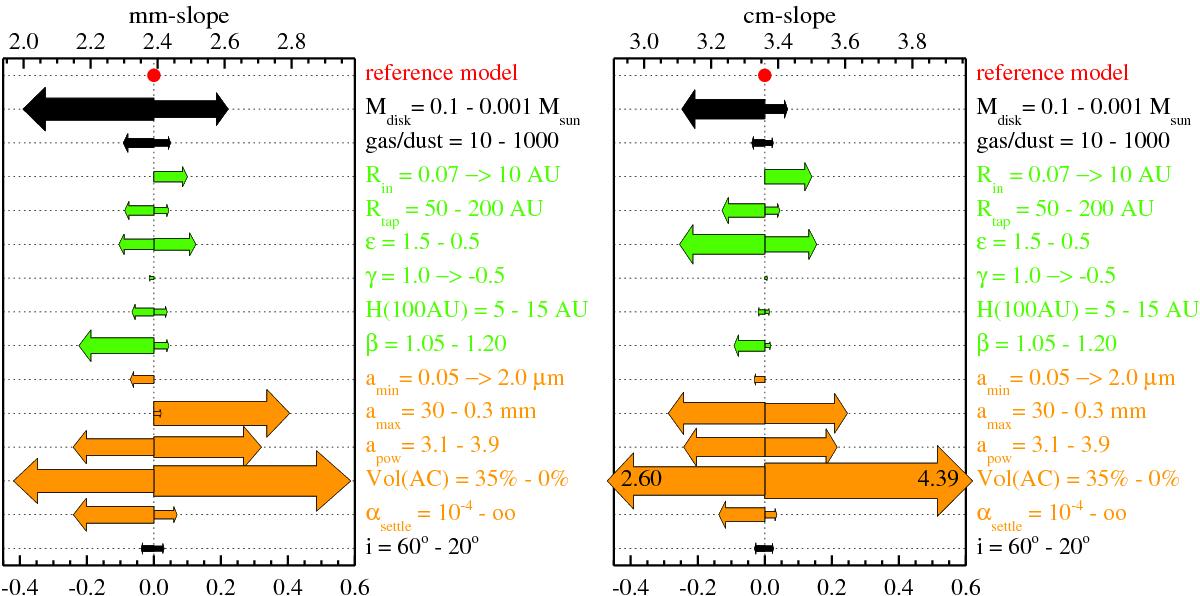
Impact of model parameters on the millimetre SED slope (left) and centimetre SED slope (right), as defined by Eqs. (D.7) and (D.8), respectively. The model parameters which have been varied are listed to the right of each plot (see Table 3 for explanations of the symbols), along with the ranges explored. The colours indicate different groups of model parameters. Gas and dust masses are shown in black, disk shape parameters in green, and dust size, material and settling parameters in orange. The changes of the observable quantity, here e.g. the mm-slope, caused by varying a particular model parameter, are shown with arrows. The original value of the observable quantity is shown by the red point marked with “reference model” (for example, 2.4 for the mm-slope), where the top x-axis provides an absolute scale, and the bottom x-axis provides a relative scale with respect to the value obtained by the reference model. The arrows indicate the direction and magnitude of changes caused. Leftward arrows indicate a flattening of the SED, rightward arrows a steepening. The corresponding parameter values are shown to the left and right of the “–” to the right of each plot. For example, increasing the disk mass Mdisk from the reference value to 0.1 M⊙ results in a flatter SED ![]() , whereas decreasing Mdisk to 0.001 M⊙ leads to a slightly steeper SED
, whereas decreasing Mdisk to 0.001 M⊙ leads to a slightly steeper SED ![]() . If there is a “→” on the r.h.s., it means that only one parameter direction has been explored and that there is only one corresponding arrow. In those cases, the parameter value to the left of “→” is the value in the reference model. In one case (the mm-slope as function of amax) both directions of parameter changes resulted in a steepening, here the small arrow belongs to amax = 30 mm.
. If there is a “→” on the r.h.s., it means that only one parameter direction has been explored and that there is only one corresponding arrow. In those cases, the parameter value to the left of “→” is the value in the reference model. In one case (the mm-slope as function of amax) both directions of parameter changes resulted in a steepening, here the small arrow belongs to amax = 30 mm.
Current usage metrics show cumulative count of Article Views (full-text article views including HTML views, PDF and ePub downloads, according to the available data) and Abstracts Views on Vision4Press platform.
Data correspond to usage on the plateform after 2015. The current usage metrics is available 48-96 hours after online publication and is updated daily on week days.
Initial download of the metrics may take a while.