Fig. 1
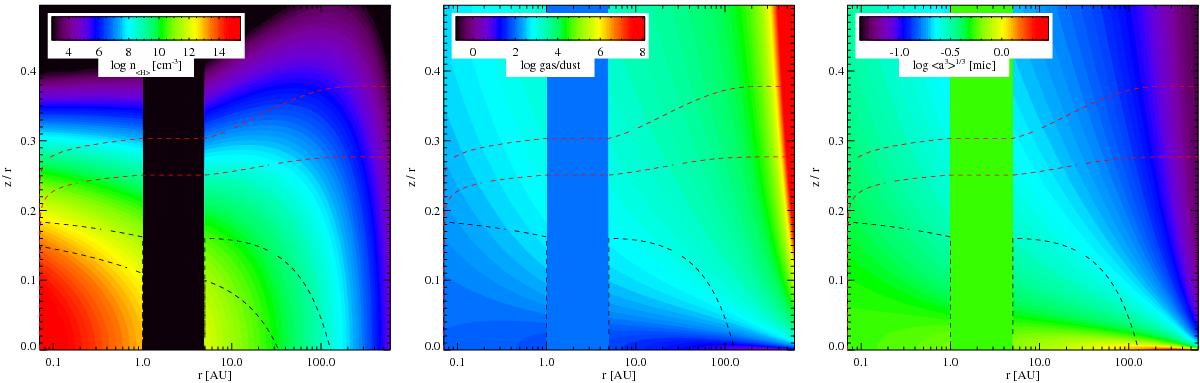
Three figures visualising our disk modelling approach concerning disk shape and dust settling. This particular model has two radial zones, with a (dust and gas-free) gap between r = 1 AU to r = 5 AU. The outer zone is featured by a tapered outer edge. The left plot shows the hydrogen nuclei particle density n⟨ H ⟩(r,z). The middle and right plots show the local gas/dust ratio, and the mean dust particle size, respectively. These two properties are not constant throughout the disk, but depend on r and z through dust settling, see Sect. 3.5. From top to bottom, the two red dashed contour lines show the radial optical depth, in terms of the visual extinction, AV,rad = 0.01 and AV,rad = 1, and the two dashed black contours show the vertical optical depths AV = 1 and AV = 10. In the middle and r.h.s. plots, the vertical AV = 10 contour line has been omitted.
Current usage metrics show cumulative count of Article Views (full-text article views including HTML views, PDF and ePub downloads, according to the available data) and Abstracts Views on Vision4Press platform.
Data correspond to usage on the plateform after 2015. The current usage metrics is available 48-96 hours after online publication and is updated daily on week days.
Initial download of the metrics may take a while.