Fig. 3
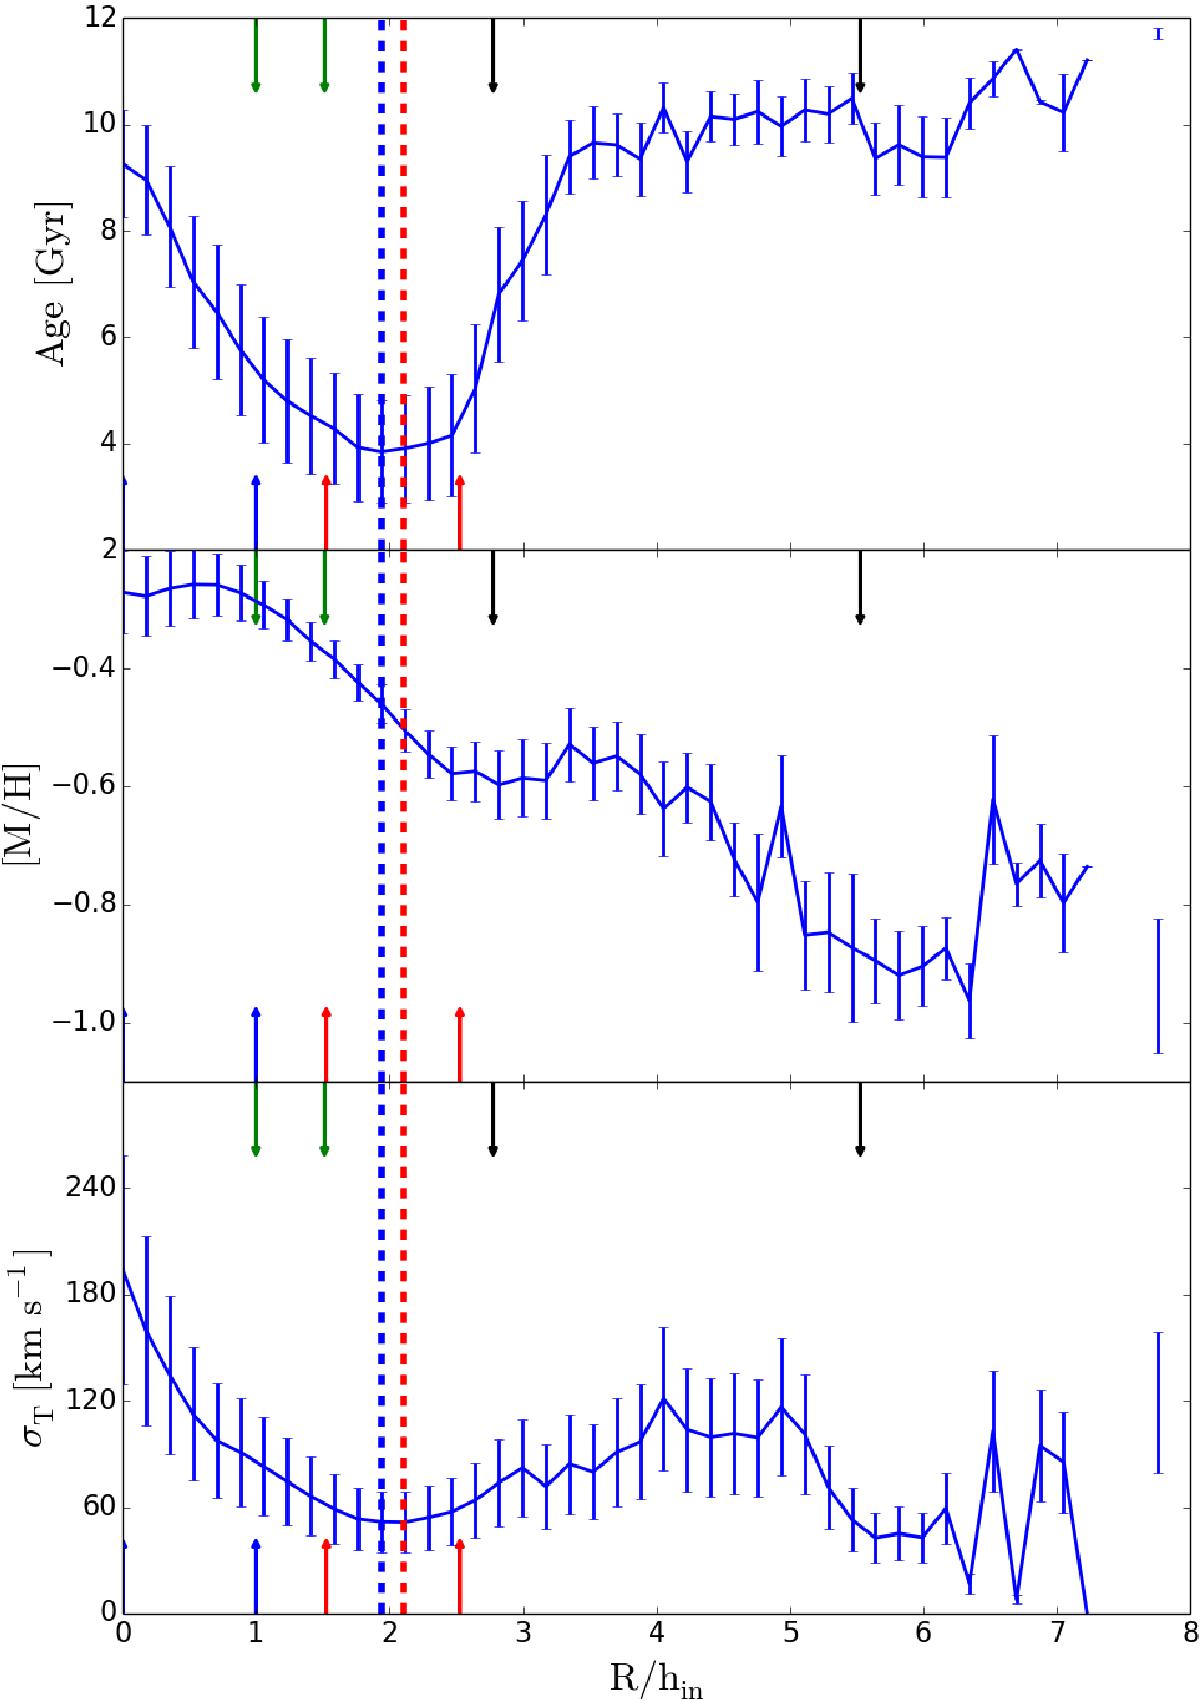
Upper panel: Selene stellar disc age profile. Middle panel: Selene stellar disc metallicity profile. Bottom panel: Selene total velocity dispersion profile (disc stars). Red (blue) vertical dashed lines are located at the surface brightness break (minimum age) radius. The errorbars indicate the standard deviation of the values of every particle within each radial bin. hin is the inner disc scale length in SDSS r-band mock images from SUNRISE (Jonsson 2006). These mock images can be seen in Few et al. (2012). Vertical arrows are located at the beginning and the end of the four regions defined in Table 2. Blue, region 1; green, region 2; red, region 3; black, region 4.
Current usage metrics show cumulative count of Article Views (full-text article views including HTML views, PDF and ePub downloads, according to the available data) and Abstracts Views on Vision4Press platform.
Data correspond to usage on the plateform after 2015. The current usage metrics is available 48-96 hours after online publication and is updated daily on week days.
Initial download of the metrics may take a while.