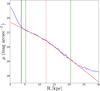
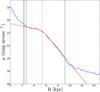
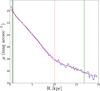
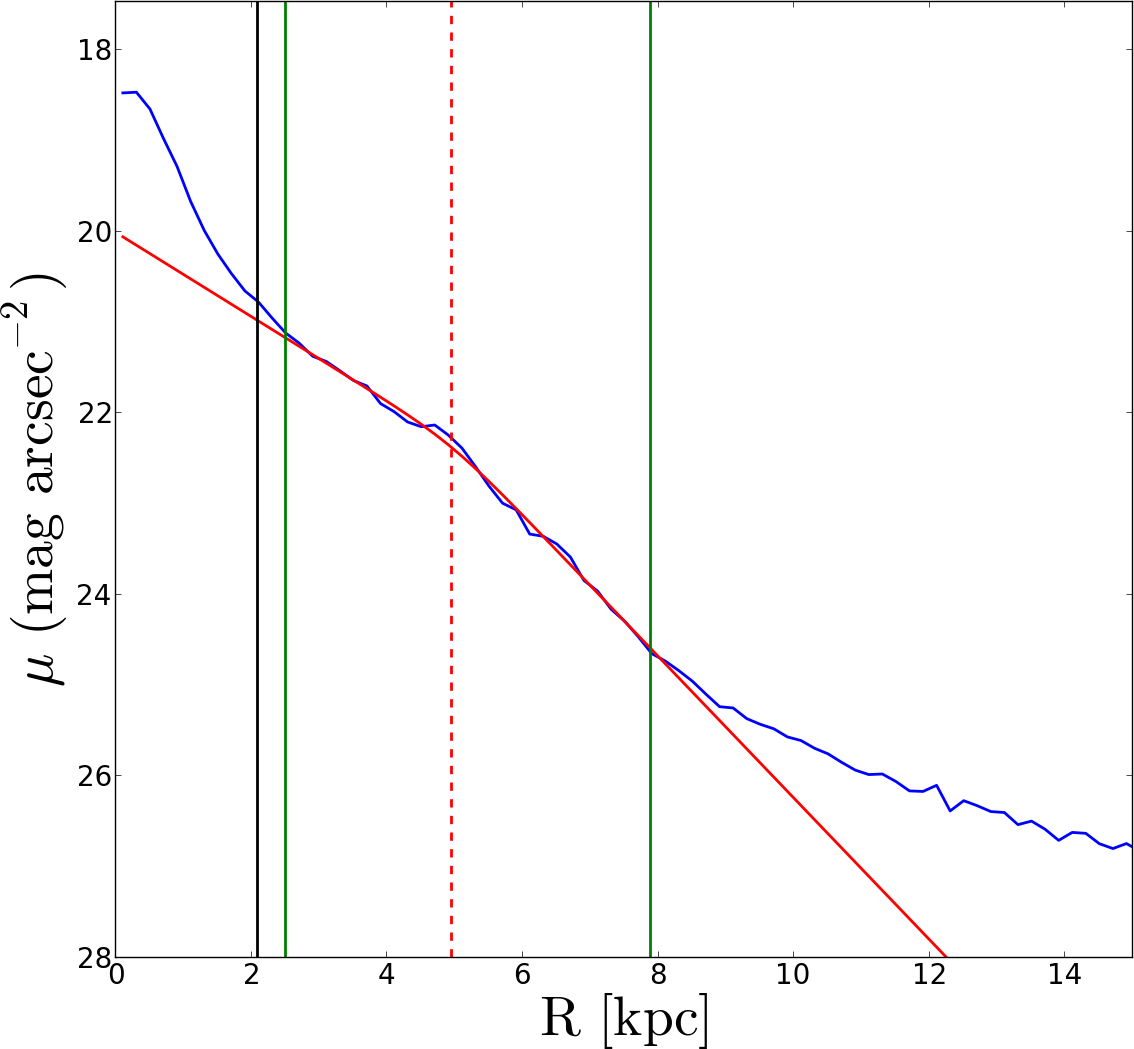
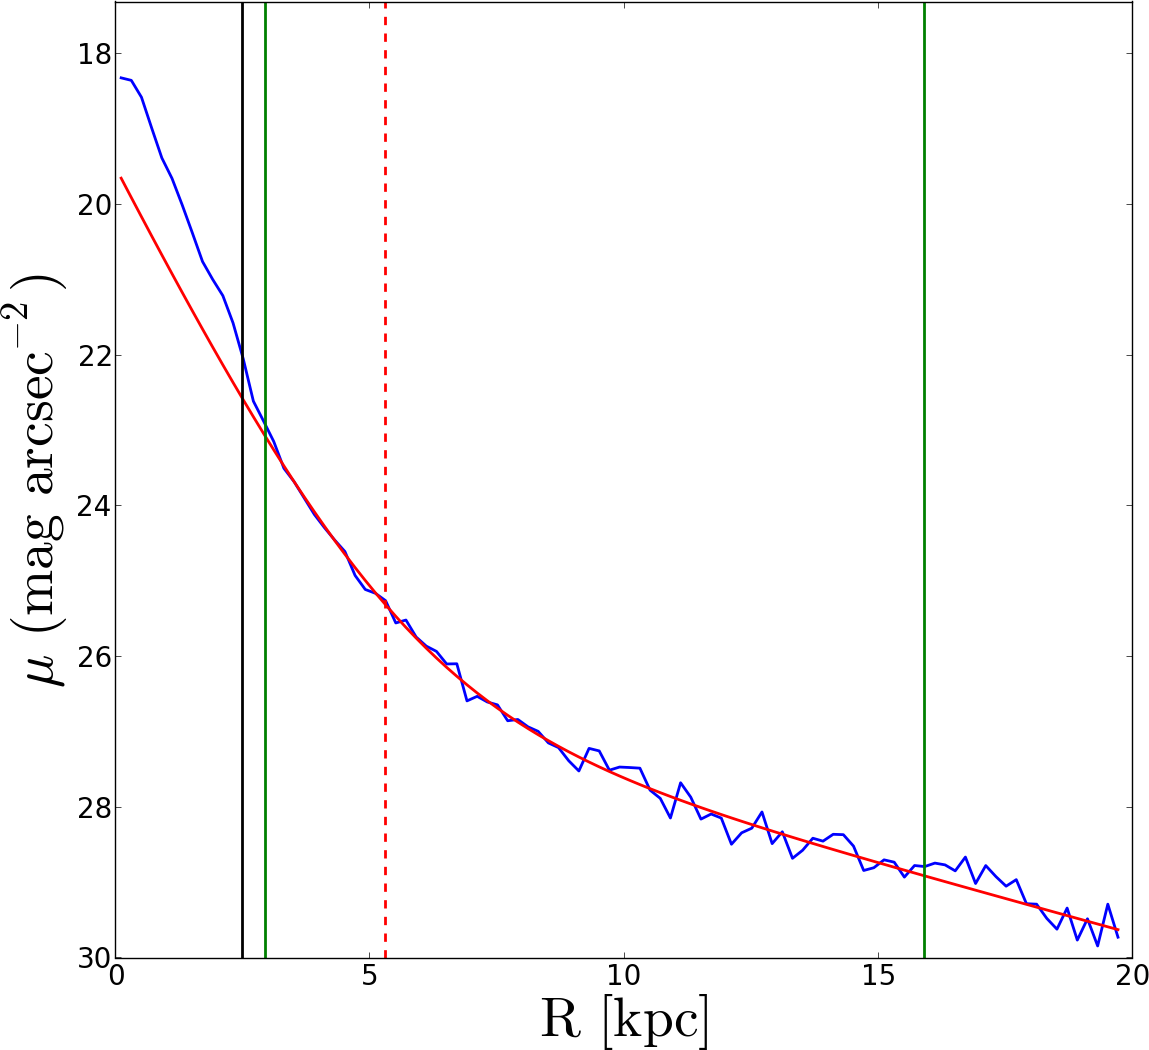
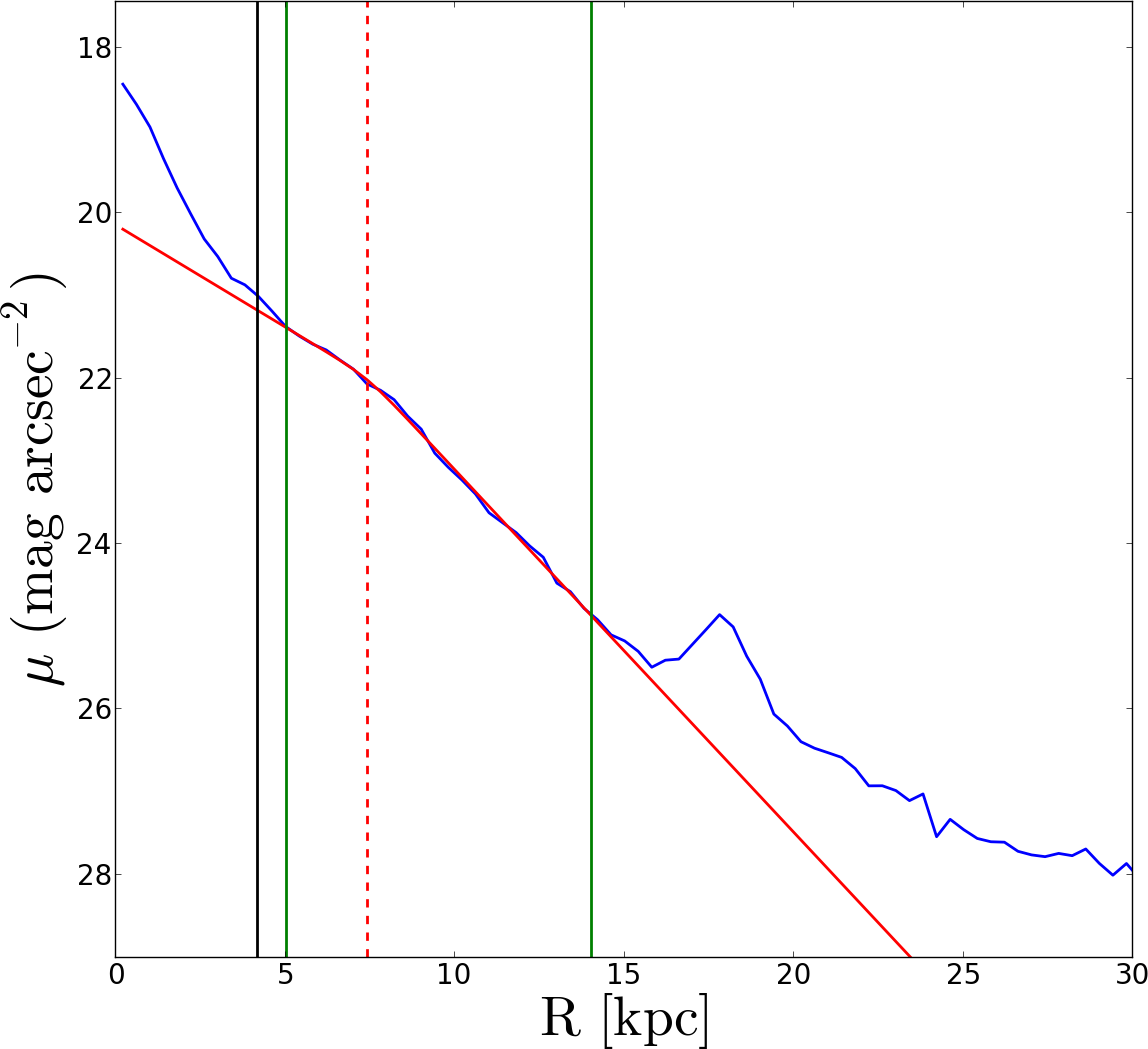
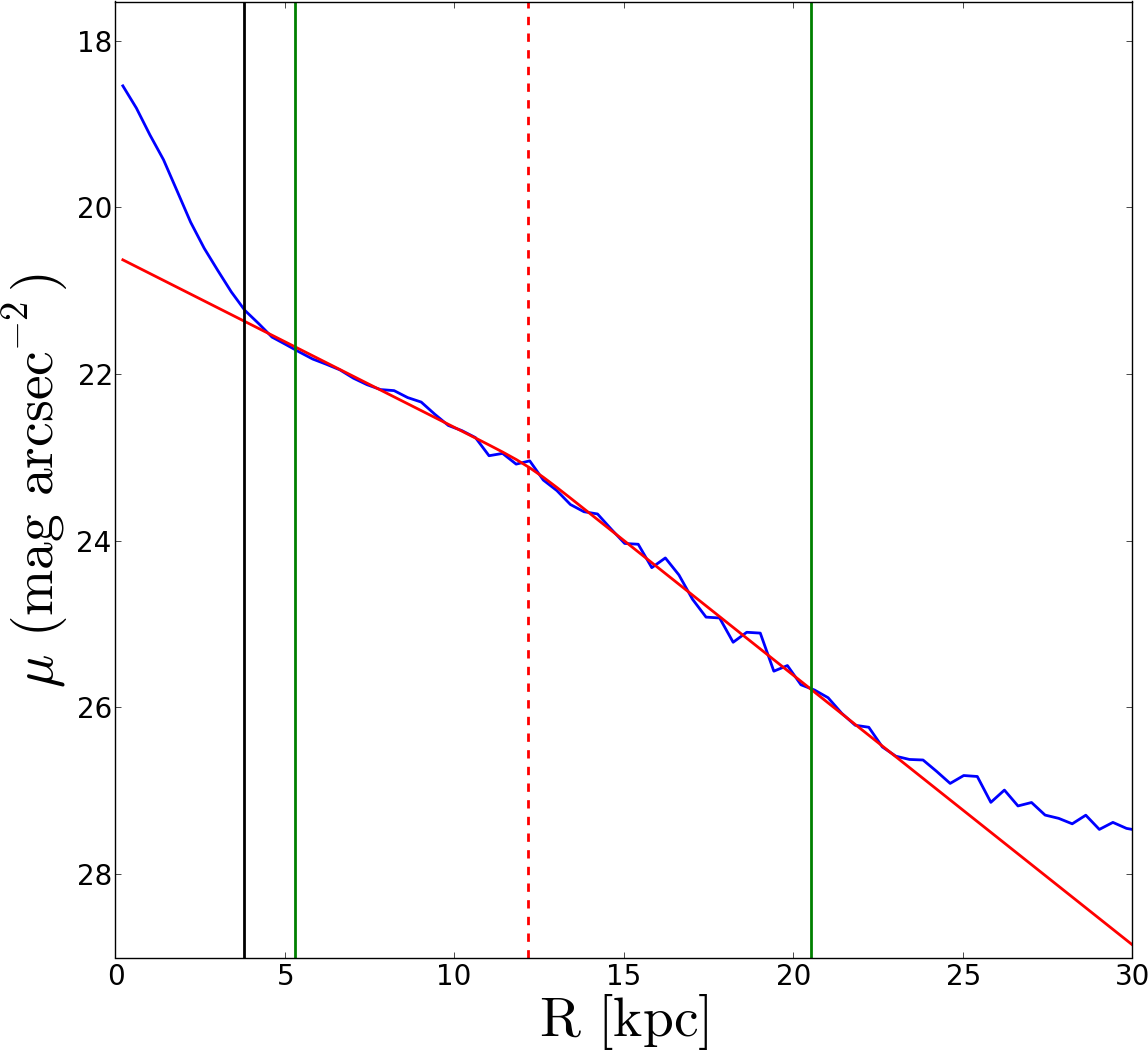
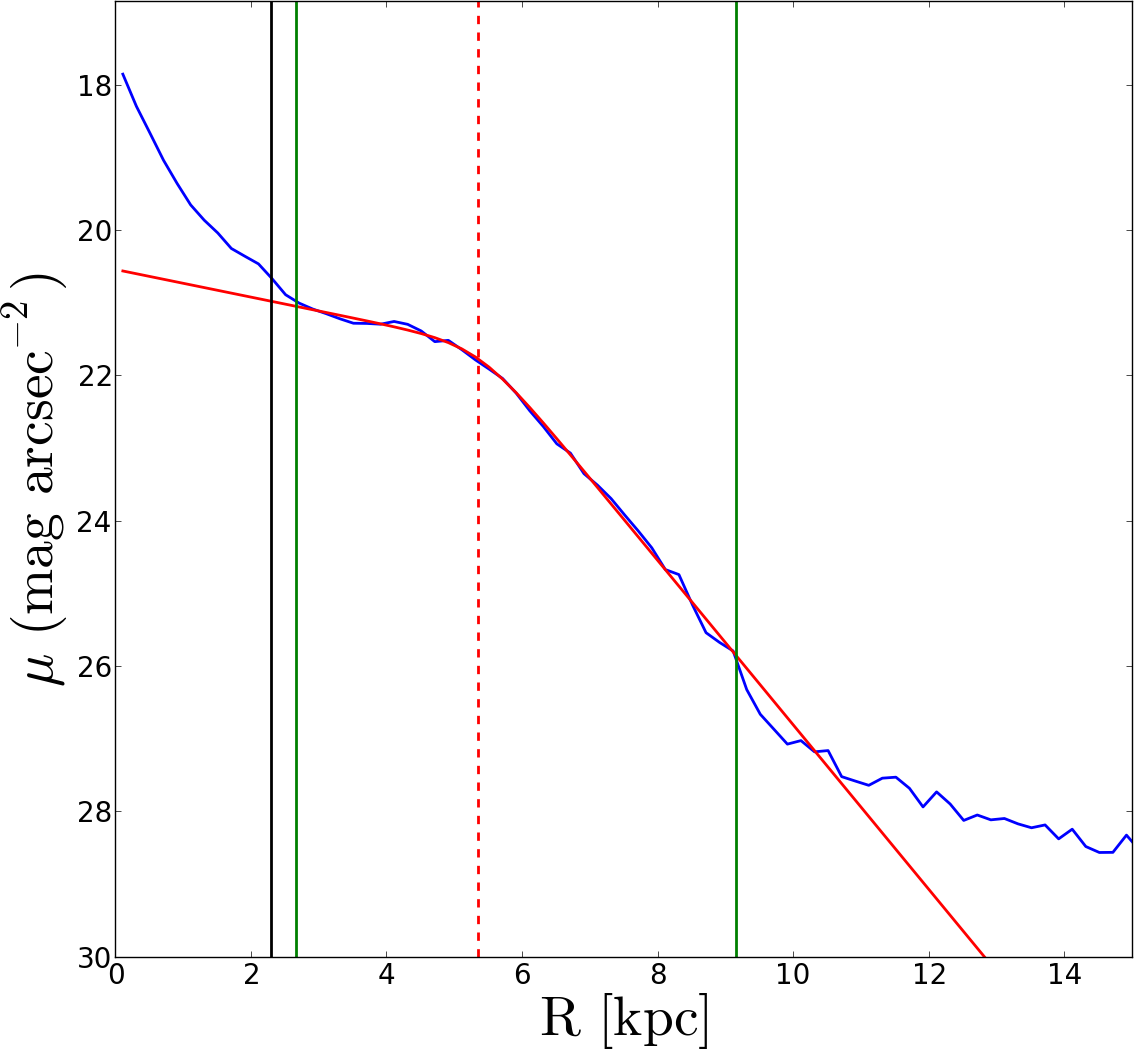
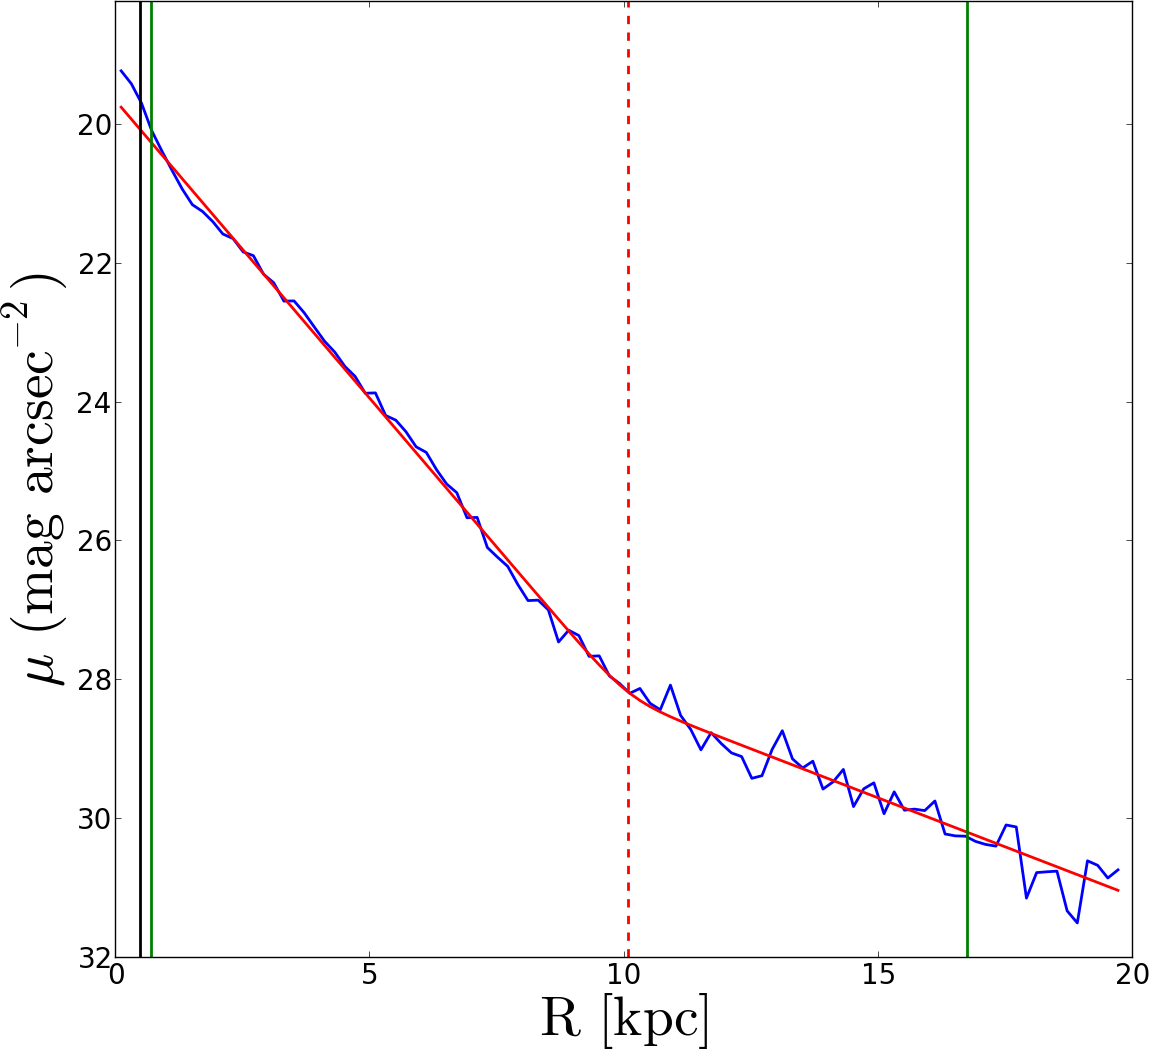
Fig. A.1
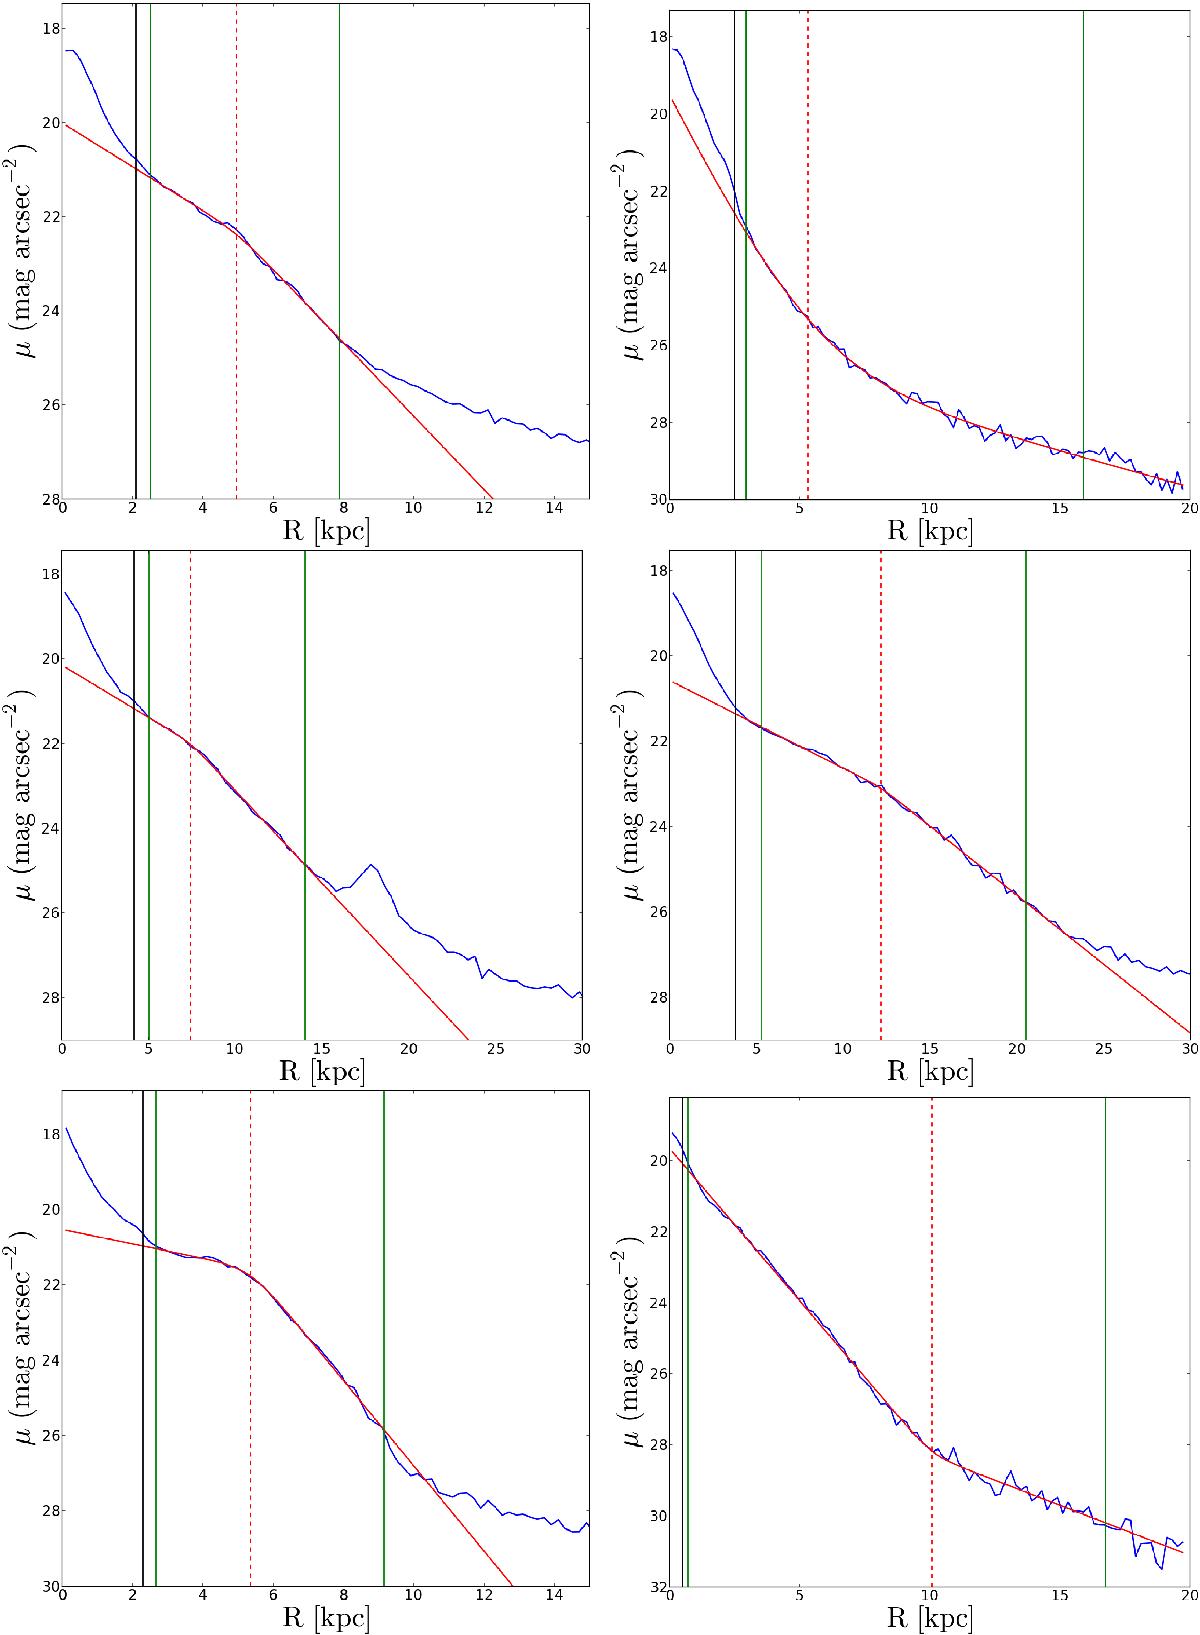
Surface brightness profiles in SDSS r band for Apollo (top left), Artemis (top right), Atlas (middle left), Ben (middle right), Castor (bottom left), and Daphne (bottom right). Blue solid line: “observed” SB profile using the SUNRISE (Jonsson 2006) mock images; those images can be seen in Few et al. (2012). Red solid line: single/double disc fit. Green, vertical, solid lines: these lines delimit the extent where the fit has been performed. Black vertical solid line: Boundary between the spheroid component and the disc; it is computed as the point where the distance between red and blue solid lines is less than 0.1 mag arcsec-1. Red, vertical, dashed line: location of the break.
Current usage metrics show cumulative count of Article Views (full-text article views including HTML views, PDF and ePub downloads, according to the available data) and Abstracts Views on Vision4Press platform.
Data correspond to usage on the plateform after 2015. The current usage metrics is available 48-96 hours after online publication and is updated daily on week days.
Initial download of the metrics may take a while.