Fig. 13
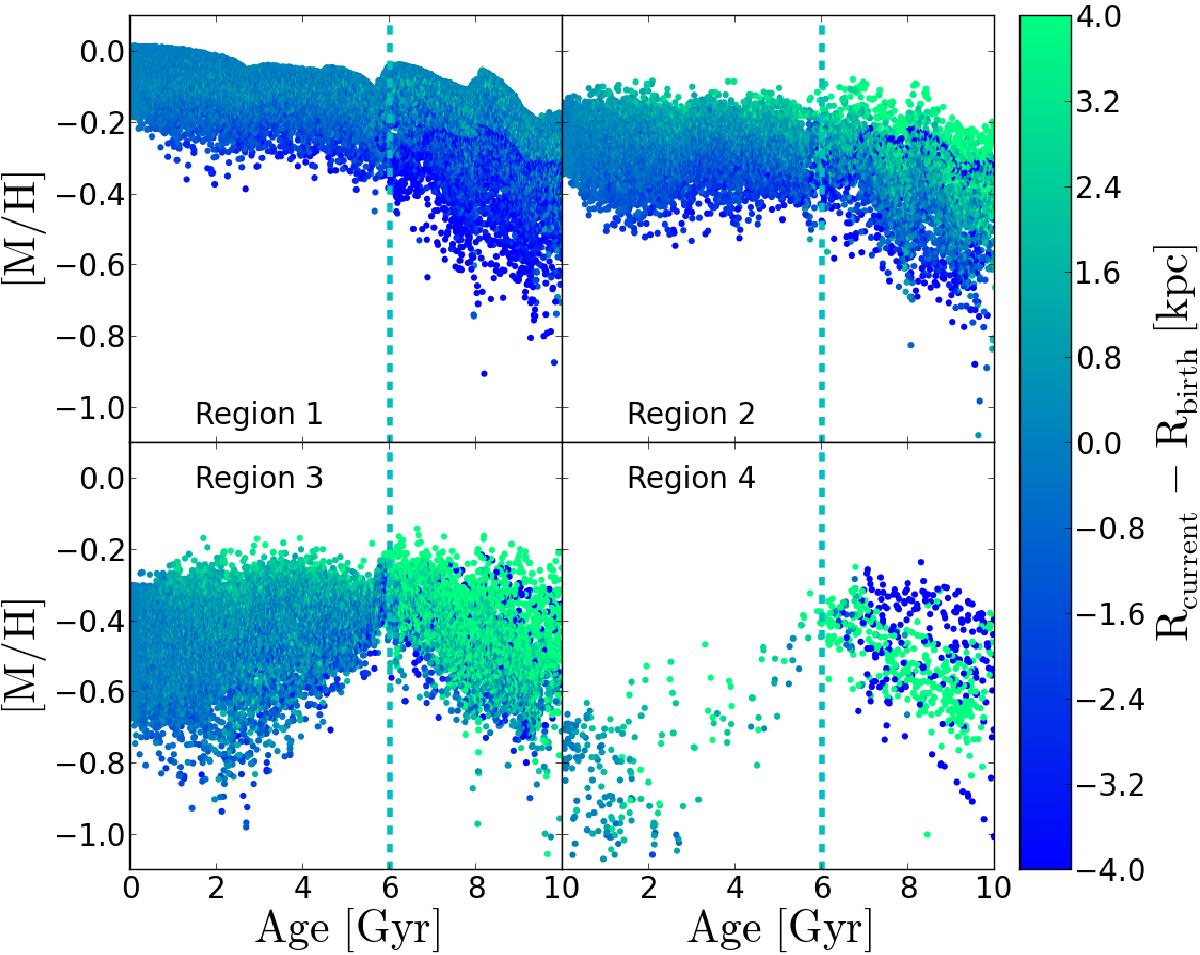
Age-metallicity relation for Selene disc particles in four radial bins (current positions); every point represents a stellar particle colour-coded according to its Rcurrent − Rbirth. Distribution of plots as in Fig. 12 (regions 1 to 4). Dashed cyan vertical lines are located at tjump. We must highlight that, although the colour-coded range goes from −4 to 4 kpc, we plot all the disc particles in that region, i.e. light green (dark blue) really means Rcurrent − Rbirth ≥ 4.0 (Rcurrent − Rbirth ≤ − 4.0).
Current usage metrics show cumulative count of Article Views (full-text article views including HTML views, PDF and ePub downloads, according to the available data) and Abstracts Views on Vision4Press platform.
Data correspond to usage on the plateform after 2015. The current usage metrics is available 48-96 hours after online publication and is updated daily on week days.
Initial download of the metrics may take a while.