Fig. 12
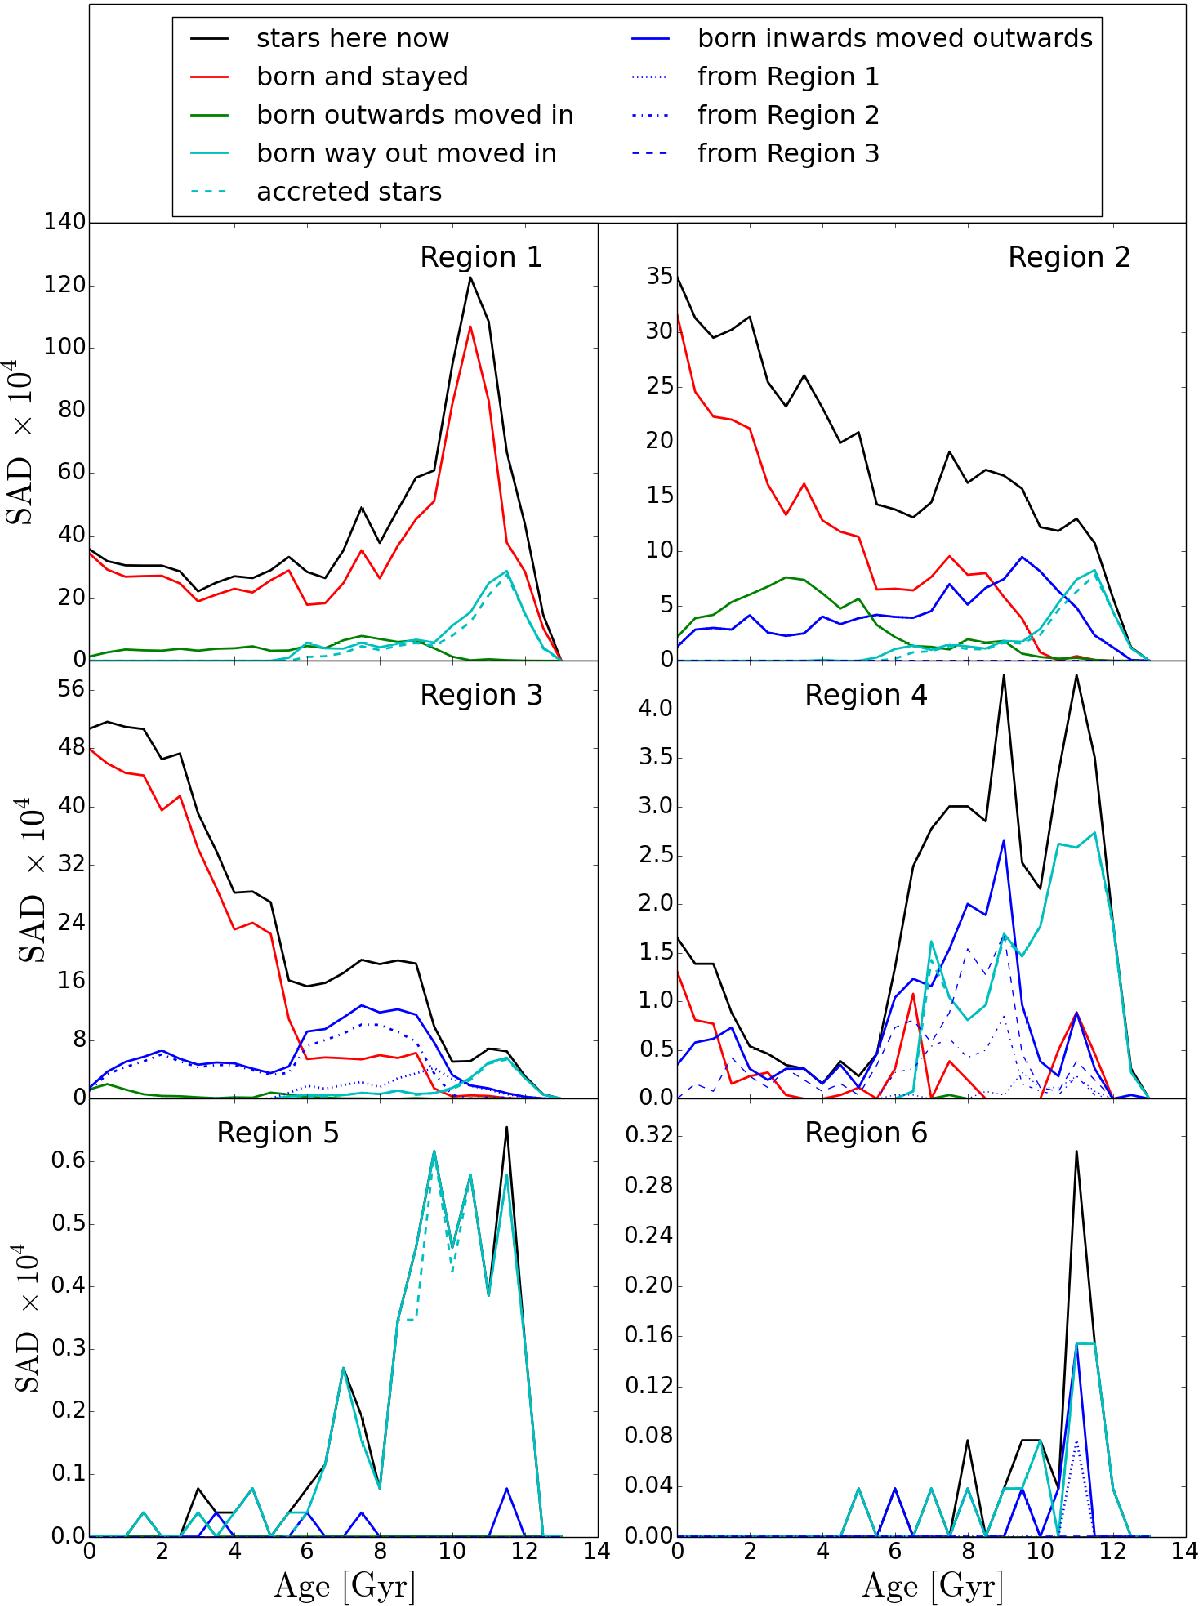
Radially resolved, stellar age distribution for the Selene disc normalised to the total stellar mass. The different panels show the stellar age distribution of the stars currently located in regions 1 (upper left), 2 (upper right), 3 (middle left), and 4 (middle right); see Table 2 for more information. We added two more regions in the outer most part of the galaxy. Region 5 goes from 4.4hin to 6.2hin and region 6 goes from 6.2hin to 7.9hin. These two regions have been added to study the causes of the old plateau in the age distribution seen in the outermost disc. Black solid lines represent particles currently in that region; solid red line particles born and stayed there; solid blue line particles born inwards and moved outwards currently in that region; solid green line particles born outwards and moved in; solid cyan line particles born way out and moved in; dashed cyan line accreted particles (i.e. Rbirth> 20 kpc and | z | > 3 kpc); dotted blue line particles born in region 1 that end up there; dotted-dashed blue line particles born in region 2 that end up there; and dashed blue line particles born in region 3 that end up there. The definitions of the lines are described in full in the main text.
Current usage metrics show cumulative count of Article Views (full-text article views including HTML views, PDF and ePub downloads, according to the available data) and Abstracts Views on Vision4Press platform.
Data correspond to usage on the plateform after 2015. The current usage metrics is available 48-96 hours after online publication and is updated daily on week days.
Initial download of the metrics may take a while.