Fig. 1
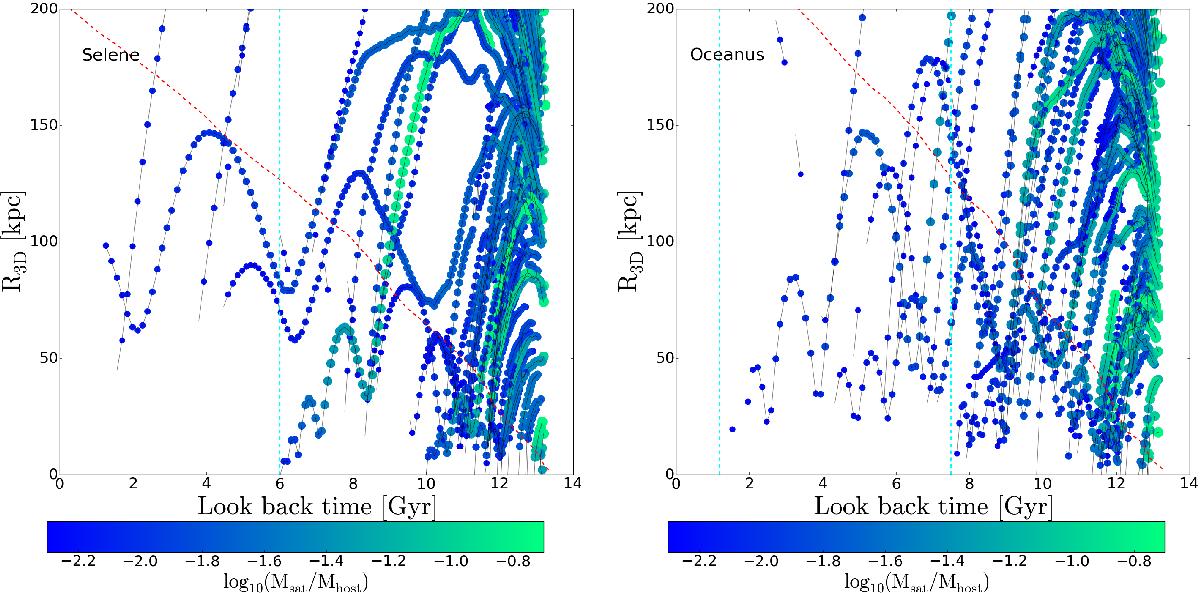
Schematic representation of the satellite orbits for Selene (left) and Oceanus (right). On the y-axis we plot the three-dimensional distance (R3D) from the satellite centre to the host galaxy centre. On the x-axis we plot the lookback time (13.5 Gyr being the beginning of the simulation). Each point represents one satellite at a given snapshot with points corresponding to the same satellite at different timesteps linked by a solid black line. In some cases, the halo tracking between snapshots fails, leading to missing connecting lines. We colour-code the points according to log10(Msat/Mhost) (the size of each point is also proportional to that value) as an indicator of the magnitude of the mergers. We have applied a cut in log10(Msat/Mhost) to clean the plot of the least massive satellites; satellites with (Msat/Mhost)t below 0.005 are ruled out in the plots. The dashed red line represents the time evolution of the host galaxy virial radius. Last merger times (tjump) are denoted via dashed cyan vertical lines. For Selene (left) the last merger happened 6.0 Gyr ago with Msat/Mhost ~ 0.089 when it enters the virial radius and ~0.0126 when the merger happens. The two merging events associated with the cessation of the two assembly phases in Oceanus (right), where (Msat/Mhost)v is ~0.056 (0.05) and (Msat/Mhost)t is ~0.006 (0.005) for the first (second) merging event finishing each epoch.
Current usage metrics show cumulative count of Article Views (full-text article views including HTML views, PDF and ePub downloads, according to the available data) and Abstracts Views on Vision4Press platform.
Data correspond to usage on the plateform after 2015. The current usage metrics is available 48-96 hours after online publication and is updated daily on week days.
Initial download of the metrics may take a while.