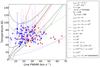
Fig. 9
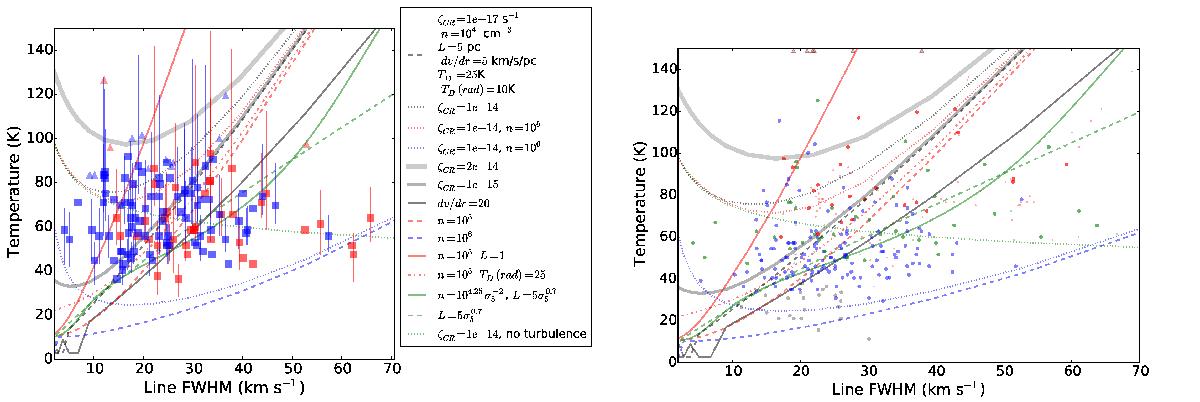
Gas kinetic temperature vs. linewidth. The lines in both plots show modeled temperatures as a function of line width given different assumptions as computed by DESPOTIC. A version of this plot with no data is shown in Fig. F.1. The legend shows the various assumptions, with the fiducial assumptions indicated at the top, associated with the dashed gray line; these fiducial values are kept fixed except where indicated. The colors of the curves each correspond to a different density, while different line styles indicate changes in other physical constants. The green solid curve shows a pressure equilibrium case (n ∝ σ-2) with a Larson relation (L ∝ σ0.7) based on Shetty et al. (2012). a) The fitted temperature as described in Sect. 4.2 plotted against the fitted line width for the by-eye selected regions. The blue symbols are compact “clump” sources and the red symbols are large-area (8′) square regions. The very broad line regions, FWHM ≳ 40 km s-1, are sometimes affected by significant baseline issues, and it is possible that the temperature has been underestimated as a result (underestimated 32,1−22,0 lines, and therefore underestimated temperatures, are possible because of the lower signal-to-noise of the 32,1−22,0 line; the 30,3−20,2 line is less likely to be affected). b) The same as a) but for the dendrogram-extracted sources. The points are color coded by signal-to-noise in the ratio R1, with black S/N< 5, blue 5 <S/N< 25, green 25 <S/N< 50, and red S/N> 50. Small, faint points indicate ancestors in the dendrogram, while bright, large points indicate leaves. Lower limits on linewidth and temperature are indicated with triangles on the edge of the plot. Note that in both panels, any correlation is even weaker than that observed in Fig. 6 of Hüttemeister et al. (1993), who make the same plot for NH3 (4, 4) and (5, 5). Riquelme et al. (2013) also found no correlation using NH3 over a similar range of velocity dispersions. While there is no clear correlation between velocity dispersion and temperature, most data points fall within a range that is consistent with turbulent heating if the appropriate size scale is selected; see Fig. 10 for plots that account for the differing source sizes. No single cosmic ray ionization rate is capable of reproducing our observations, and the higher CRIRs (ζCR> 10-14s-1) are inconsistent with most of the data.
Current usage metrics show cumulative count of Article Views (full-text article views including HTML views, PDF and ePub downloads, according to the available data) and Abstracts Views on Vision4Press platform.
Data correspond to usage on the plateform after 2015. The current usage metrics is available 48-96 hours after online publication and is updated daily on week days.
Initial download of the metrics may take a while.