Fig. 8
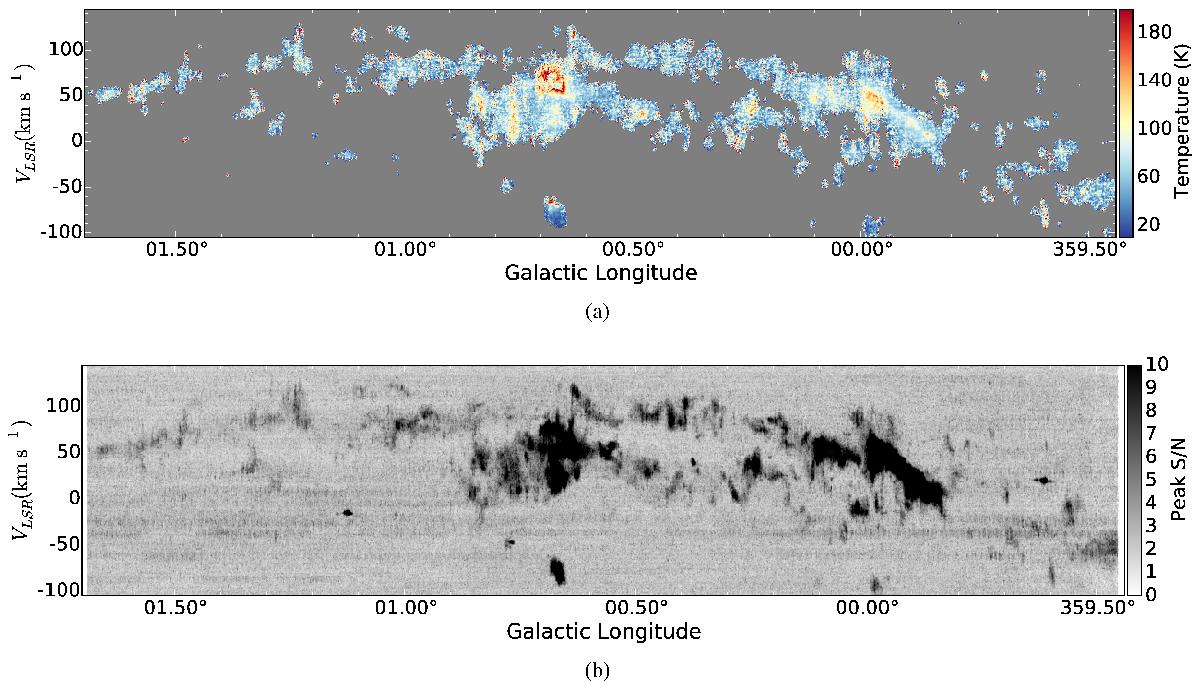
a) A Galactic longitude-velocity diagram made by taking the 30,3−20,2-weighted average of the R1 PPV cube along Galactic latitude and using the n = 104 cm-3 curve from Fig. 6 to derive temperature. b) A Galactic longitude-velocity map of peak signal-to-noise along Galactic latitude, which is used as a mask in a). The apparently cold clumps at –80 km s-1 in Sgr B2 and –90 km s-1 in Sgr A are from a different line, HC3N 24-23: the gas temperatures from these positions are meaningless. The apparent high temperatures around the cloud edges are artifacts caused by lower signal-to-noise ratios at the edges and should be ignored.
Current usage metrics show cumulative count of Article Views (full-text article views including HTML views, PDF and ePub downloads, according to the available data) and Abstracts Views on Vision4Press platform.
Data correspond to usage on the plateform after 2015. The current usage metrics is available 48-96 hours after online publication and is updated daily on week days.
Initial download of the metrics may take a while.