Fig. 6
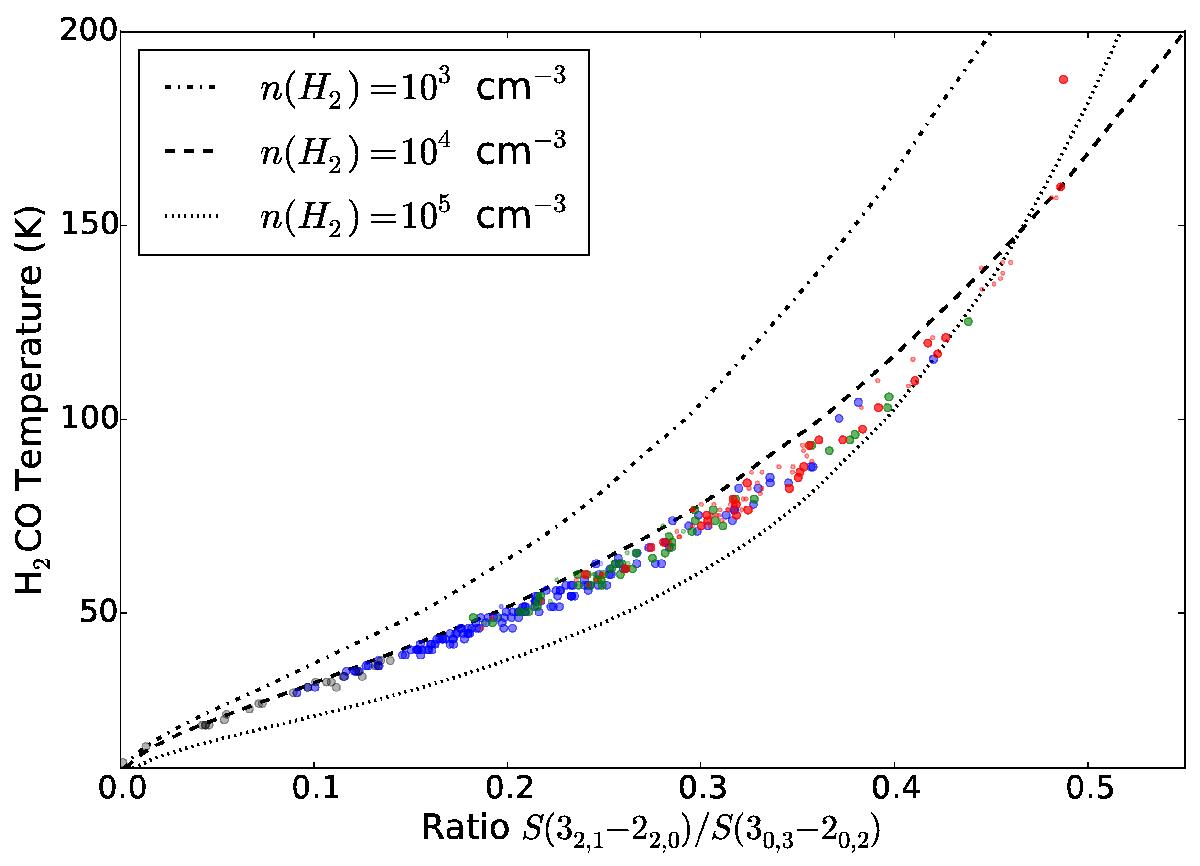
Derived temperature vs. the measured ratio p - H2CO Sν(32,1−22,0) /Sν(30,3−20,2) for the dendrogram clumps. The big symbols represent leaves (compact clumps) and the small symbols represent larger and therefore lower-density ancestor structures. The temperature includes constraints from the assumed constant H2CO abundance and the varying column density. The points are color coded by signal-to-noise in the ratio R1, with gray S/N< 5, blue 5 <S/N< 25, green 25 <S/N< 50, and red S/N> 50. The black lines show the modeled temperature as a function of R1 for three different assumed densities with a constant assumed abundance XH2CO = 1.2 × 10⁻⁹. While the measured values appear consistent with the n = 104 cm-3 curve, the systematic errors permit any density in the range 104 cm-3<n< 105 cm-3; this plot most importantly shows that n ~ 103 cm-3 is not plausible and that the temperature does not differ very much for a given value of R1 over the plausible range of densities.
Current usage metrics show cumulative count of Article Views (full-text article views including HTML views, PDF and ePub downloads, according to the available data) and Abstracts Views on Vision4Press platform.
Data correspond to usage on the plateform after 2015. The current usage metrics is available 48-96 hours after online publication and is updated daily on week days.
Initial download of the metrics may take a while.