Fig. 4
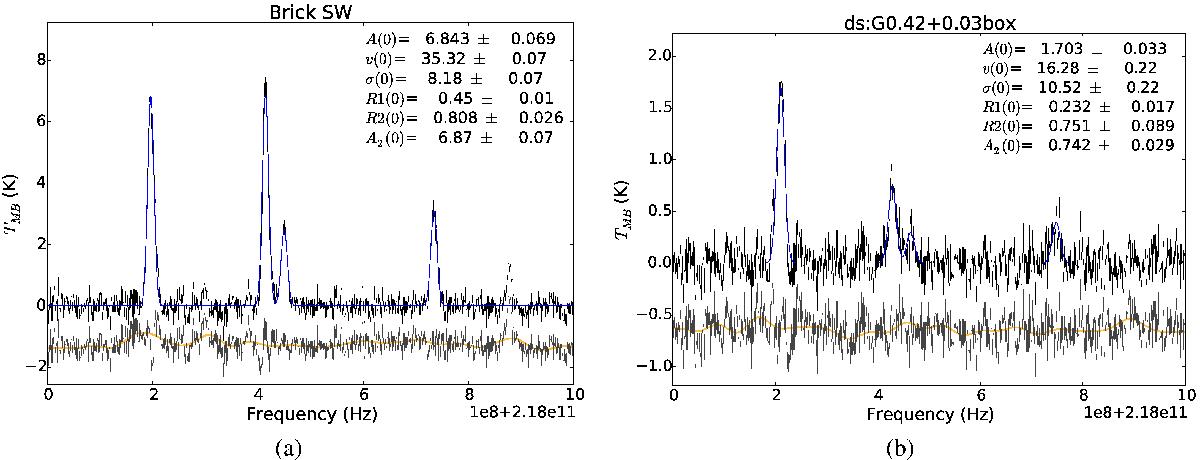
Simultaneous fits to four lines, from low to high frequency, p - H2CO30,3−20,2, CH3OH42,2−31,2, p - H2CO32,2−22,1, and p - H2CO32,1−22,0 for a) The Brick (ℓ = 0.241, b = 0.006, r = 25″) and b) a box centered on G0.42+0.03 (ℓ = 0.415, b = 0.032, ≈ 80″ × 80″). The fitted parameters shown in the legend are the amplitude of the H2CO30,3−20,2 line, the centroid velocity, the line width (σ, not FWHM), the ratio R1 = p - H2CO Sν(32,1−22,0) /Sν(30,3−20,2), the ratio R2 = p - H2CO Sν(32,2−22,1) /Sν(32,1−22,0), and the amplitude of the CH3OH42,2−31,2 line. These spectra have significantly different ratios and therefore derived temperatures: The Brick has TG ≳ 100 K while G0.42+0.03 has TG ≈ 40−50 K. The bottom black spectrum is the residual, and the orange wiggly spectrum shows the spline fit used to remove baseline ripples. The OCS 18–17 218.90336 GHz and HC3N 24–23 218.32471 GHz lines are also detected, but not fitted, in The Brick. In these examples, we are showing cases where the CH3OH42,2−31,2 and p - H2CO32,2−22,1 lines are not too badly blended, but along many lines of sight, especially those within ~20′ of Sgr B2, they are irretrievably blended.
Current usage metrics show cumulative count of Article Views (full-text article views including HTML views, PDF and ePub downloads, according to the available data) and Abstracts Views on Vision4Press platform.
Data correspond to usage on the plateform after 2015. The current usage metrics is available 48-96 hours after online publication and is updated daily on week days.
Initial download of the metrics may take a while.