Fig. E.4
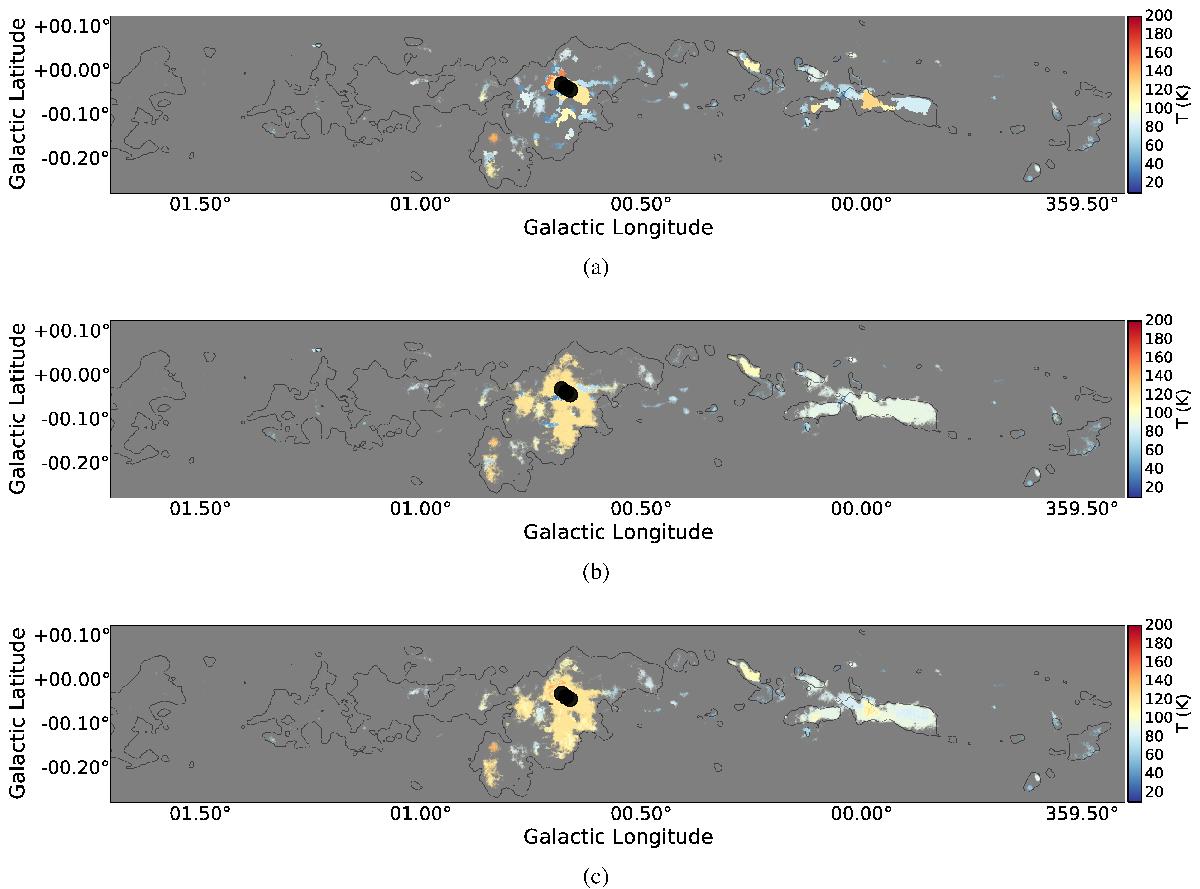
Maps generated by building a data cube in which each voxel has been replaced with the average temperature from the smallest associated dendrogram-extracted clump. These maps can be thought of as adaptively-smoothed maps, where the smoothing kernel is matched to the source size. a) The mean temperature along each line of sight through the dendrogram-extracted cube, where only the leaf nodes have been included b) The same as a), but including all ancestor nodes in addition to the leaf nodes. c) The same as b), but weighted by the 30,3−20,2 brightness. In all three panels, regions of lower signal-to-noise, and therefore less reliable temperature, are grayed out with a filter that gets more opaque toward lower signal-to-noise. The thin contours are from the Herschel HiGal dust SED fit at a level N(H2) = 5 × 1022 cm-2 and are included to provide a visual reference for comparison between the temperature maps.
Current usage metrics show cumulative count of Article Views (full-text article views including HTML views, PDF and ePub downloads, according to the available data) and Abstracts Views on Vision4Press platform.
Data correspond to usage on the plateform after 2015. The current usage metrics is available 48-96 hours after online publication and is updated daily on week days.
Initial download of the metrics may take a while.