Fig. D.1
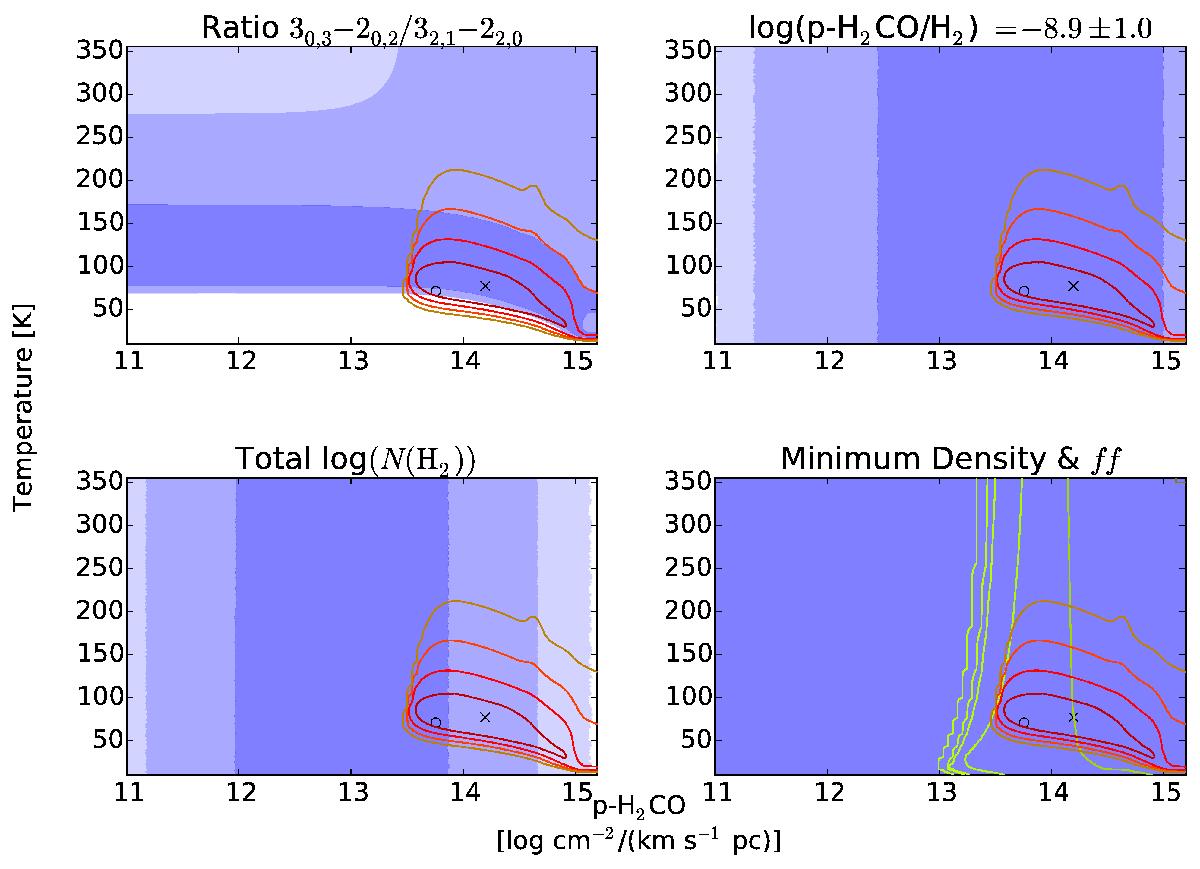
The parameter constraints for “cloud c” (Fig. 5) projected (marginalized) onto the temperature/column density plane. (top left) Constraints imposed by the measured ratio p - H2CO Sν(32,1−22,0) /Sν(30,3−20,2) are shown in the background filled colors, with significance ranges progressing from dark-light from 1–3σ. The red line contours show the joint constraints imposed by including restrictions on the total column density, volume density, filling factor, and abundance, with 1, 2, 3, and 4σ contours shown. The × marks the expectation value and the ° marks the maximum likelihood value. (top right) The same colorscheme as before, showing the constraints imposed by assuming the abundance of p - H2CO relative to H2 is as labeled. The abundance does not constrain these parameters, but in Fig. D.2, the abundance rules out a substantial region of parameter space. (bottom left) The same colorscheme as before, showing the constraints imposed by using the measured mean volume density as a lower limit. In this figure, the volume density imposes no constraint, but in Figs. D.2 and D.3 it is important. (bottom right) The same colorscheme as before, showing the constraints imposed by the measured total column density of H2. The green contours show constraints imposed by the lower limit on the area filling factor.
Current usage metrics show cumulative count of Article Views (full-text article views including HTML views, PDF and ePub downloads, according to the available data) and Abstracts Views on Vision4Press platform.
Data correspond to usage on the plateform after 2015. The current usage metrics is available 48-96 hours after online publication and is updated daily on week days.
Initial download of the metrics may take a while.