Fig. B.1
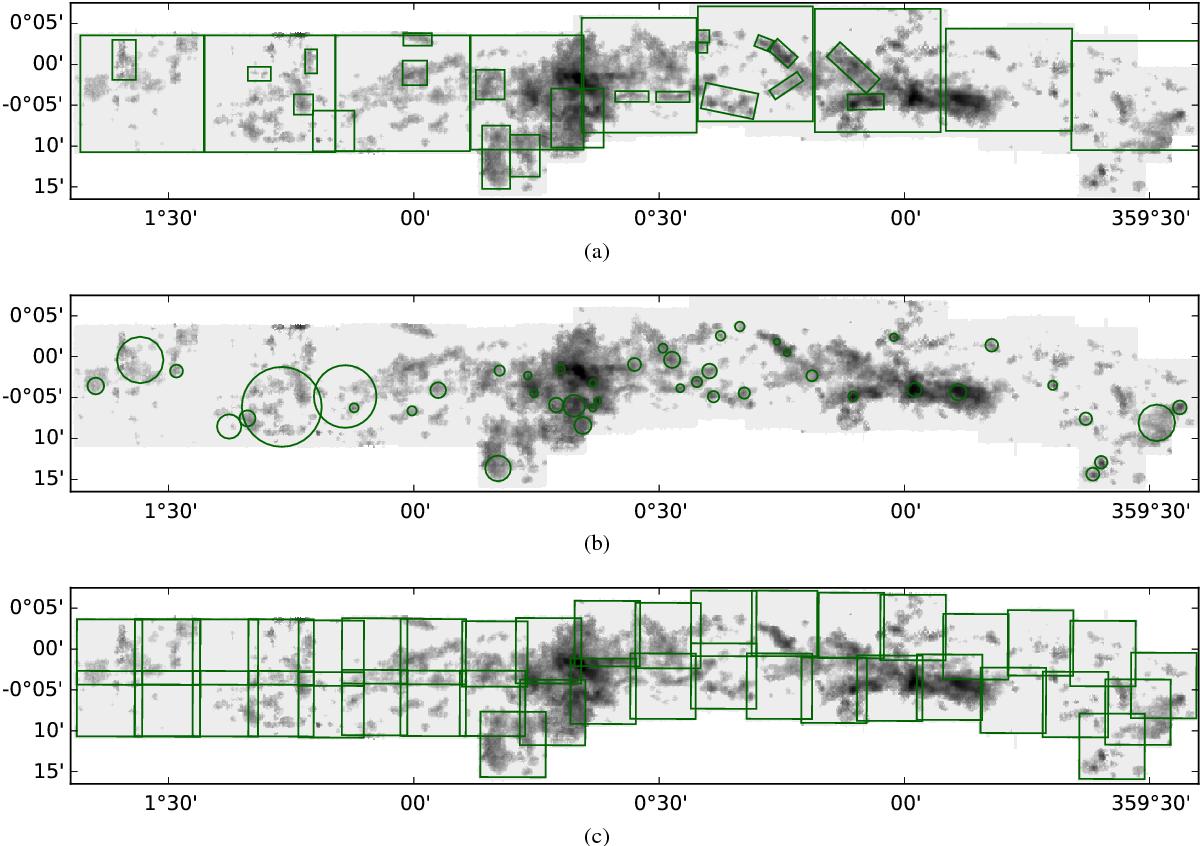
Figures showing the extracted regions. The background is the integrated masked p - H2CO30,3−20,2 image. a) Box regions created for large-scale averaging and to track the morphology of individual clumps. b) Circular regions selected to highlight points of interest c)8′ × 8′ Box regions matching the observational setup in 2014.
Current usage metrics show cumulative count of Article Views (full-text article views including HTML views, PDF and ePub downloads, according to the available data) and Abstracts Views on Vision4Press platform.
Data correspond to usage on the plateform after 2015. The current usage metrics is available 48-96 hours after online publication and is updated daily on week days.
Initial download of the metrics may take a while.