Fig. 14
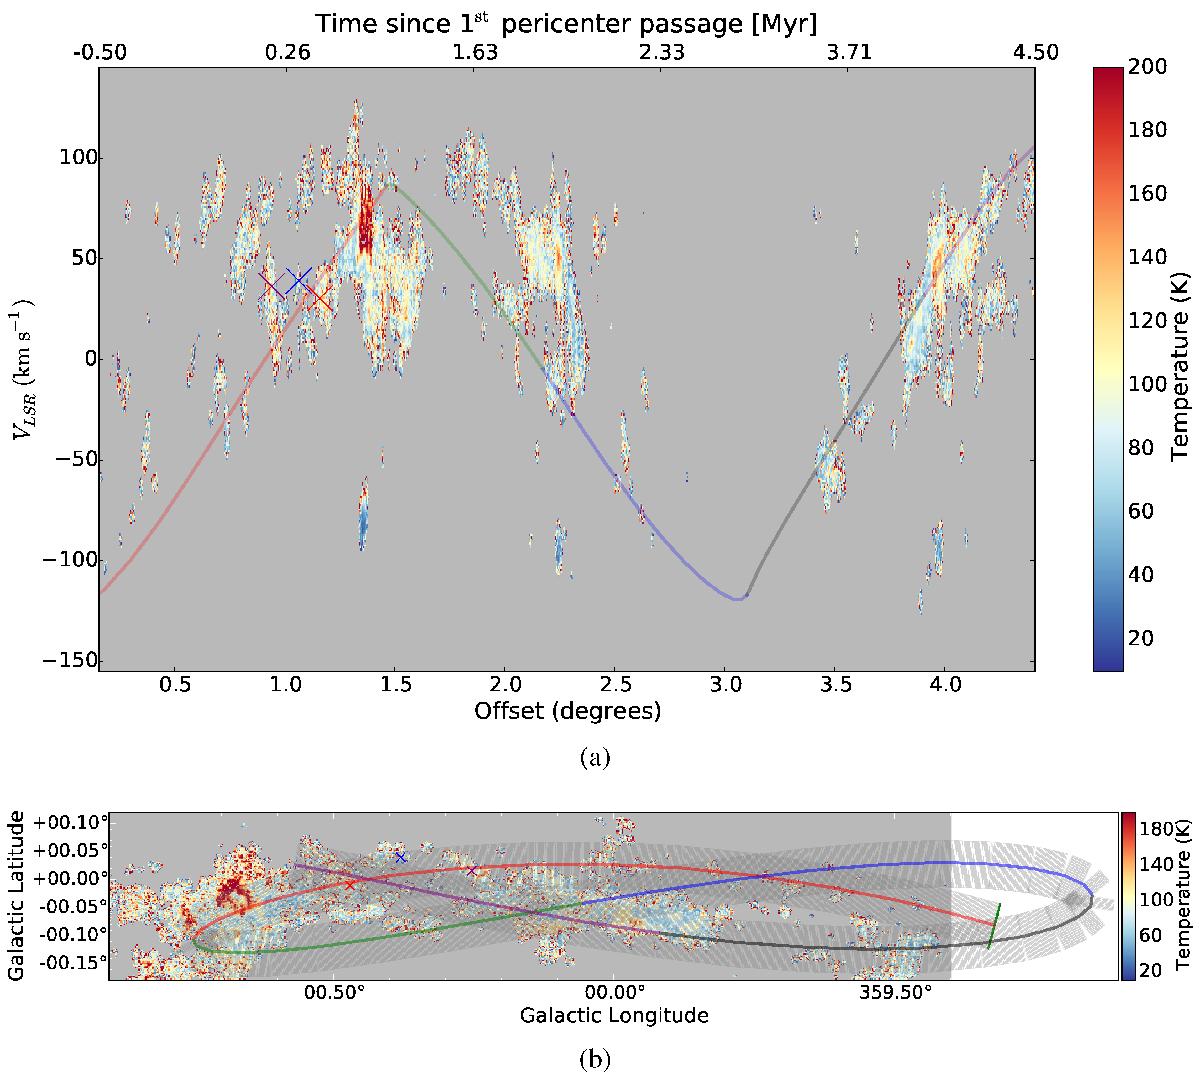
a) A position-velocity slice through the temperature cube along the Kruijssen et al. (2015) orbit. Gray regions have no gas detected or inadequate signal to measure a temperature. b) The path used to create the slice shown in a). The path consists of a series of transparent 7.2″ × 300″ rectangles over which the temperature has been averaged. The green bar at ℓ = 359.3° indicates the starting point (offset = 0) of the position-velocity slice. The orbit is outside of our observed field to the west of Sgr C. The X’s mark The Brick (purple), cloud d (blue), and cloud e (red) to provide landmarks for comparison between the two figures.
Current usage metrics show cumulative count of Article Views (full-text article views including HTML views, PDF and ePub downloads, according to the available data) and Abstracts Views on Vision4Press platform.
Data correspond to usage on the plateform after 2015. The current usage metrics is available 48-96 hours after online publication and is updated daily on week days.
Initial download of the metrics may take a while.