Fig. 11
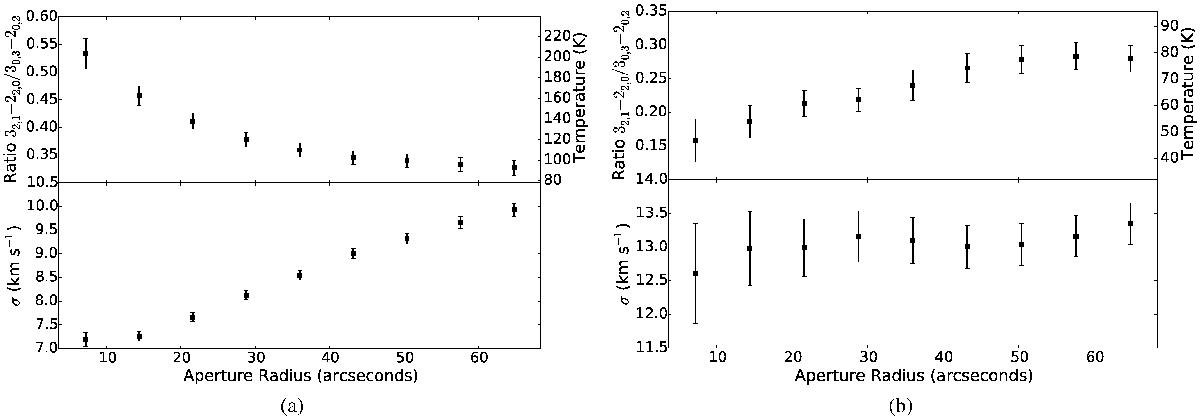
a) Radial plots centered on the southwest portion of “The Brick”. The top panel shows the ratio p - H2CO Sν(32,1−22,0) /Sν(30,3−20,2) as a function of aperture size, starting from a single pixel. The derived temperature using Fig. 6 is shown on the right axis; temperatures ≳150 K should be regarded as lower limits. The bottom panel shows the line width σ = FWHM/ 2.35 as a function of aperture size. b) The same as a) but for a region centered on G1.23-0.08, a local peak in the p - H2CO30,3−20,2 emission. In this case, the ratio p - H2CO Sν(32,1−22,0) /Sν(30,3−20,2) is lower at the center and increases toward larger radii.
Current usage metrics show cumulative count of Article Views (full-text article views including HTML views, PDF and ePub downloads, according to the available data) and Abstracts Views on Vision4Press platform.
Data correspond to usage on the plateform after 2015. The current usage metrics is available 48-96 hours after online publication and is updated daily on week days.
Initial download of the metrics may take a while.