Fig. 5
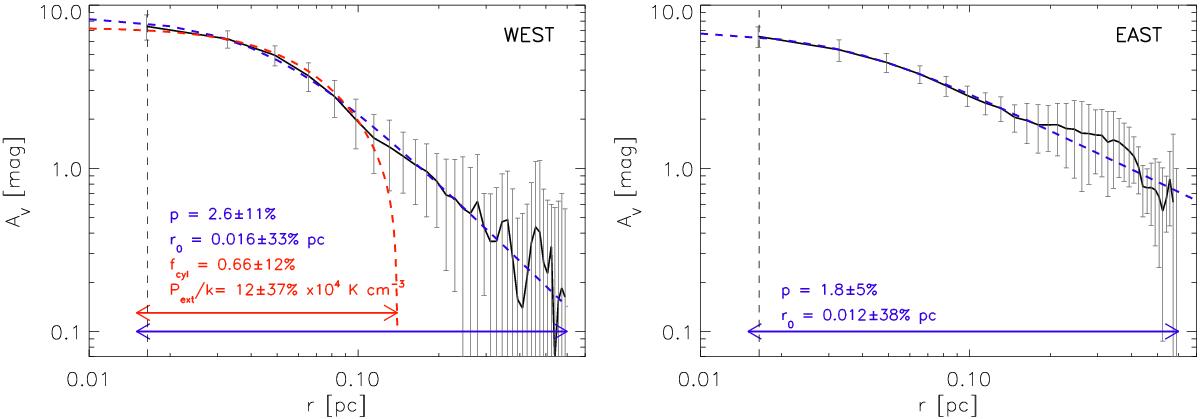
Mean radial column density profiles along the Center filament of the Musca cloud. The left and right panels show the mean profile on the west and east sides of the filament axis, respectively. The blue line shows the fit of Plummer-like profile, and red line shows the fit of a pressure-confined hydrostatic cylinder. The colored arrows indicate the radial ranges used in fitting the profiles. The error bars show the standard deviation of 20 individual profiles from which the mean profile is constructed. The vertical dashed line shows the FWHM size of the extinction mapping beam.
Current usage metrics show cumulative count of Article Views (full-text article views including HTML views, PDF and ePub downloads, according to the available data) and Abstracts Views on Vision4Press platform.
Data correspond to usage on the plateform after 2015. The current usage metrics is available 48-96 hours after online publication and is updated daily on week days.
Initial download of the metrics may take a while.