Fig. 3
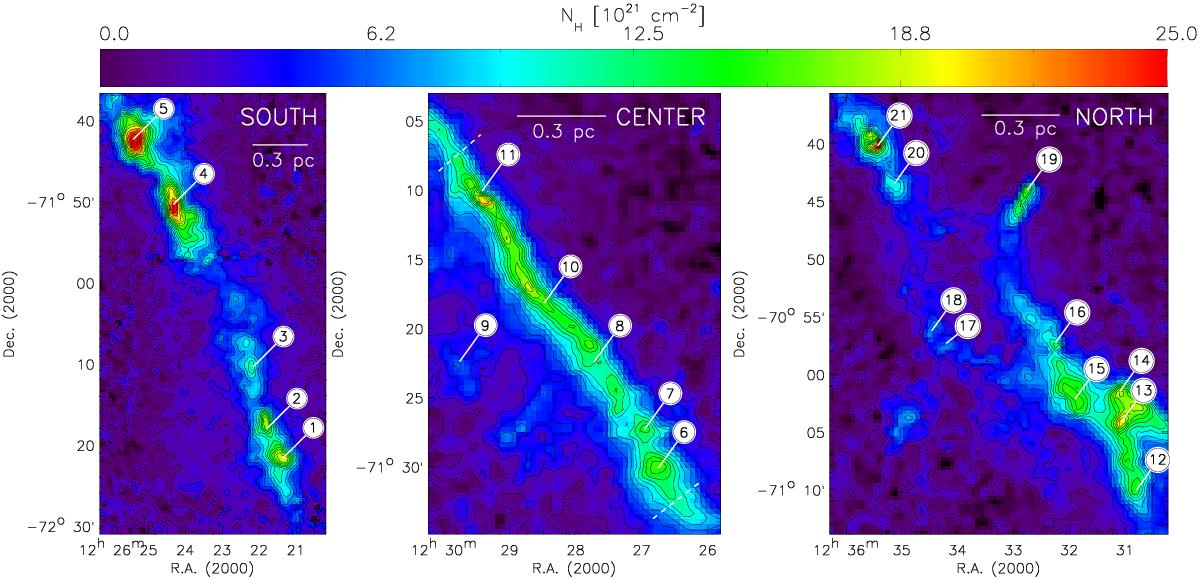
Blowups from the NIR-derived column density map of the Musca cloud (Fig. 2). The contours start at NH = 1.5 × 1021 cm-2 and the step is 1.5 × 1021 cm-2. The lowest contour is drawn with a dotted line. The dashed lines in the Center region indicate the 1.6 pc velocity-coherent filament whose radial structure is modeled in Sect. 3.2. The numbered signs refer to the fragments identified within the cloud (see Sect. 3.1).
Current usage metrics show cumulative count of Article Views (full-text article views including HTML views, PDF and ePub downloads, according to the available data) and Abstracts Views on Vision4Press platform.
Data correspond to usage on the plateform after 2015. The current usage metrics is available 48-96 hours after online publication and is updated daily on week days.
Initial download of the metrics may take a while.