Fig. 1
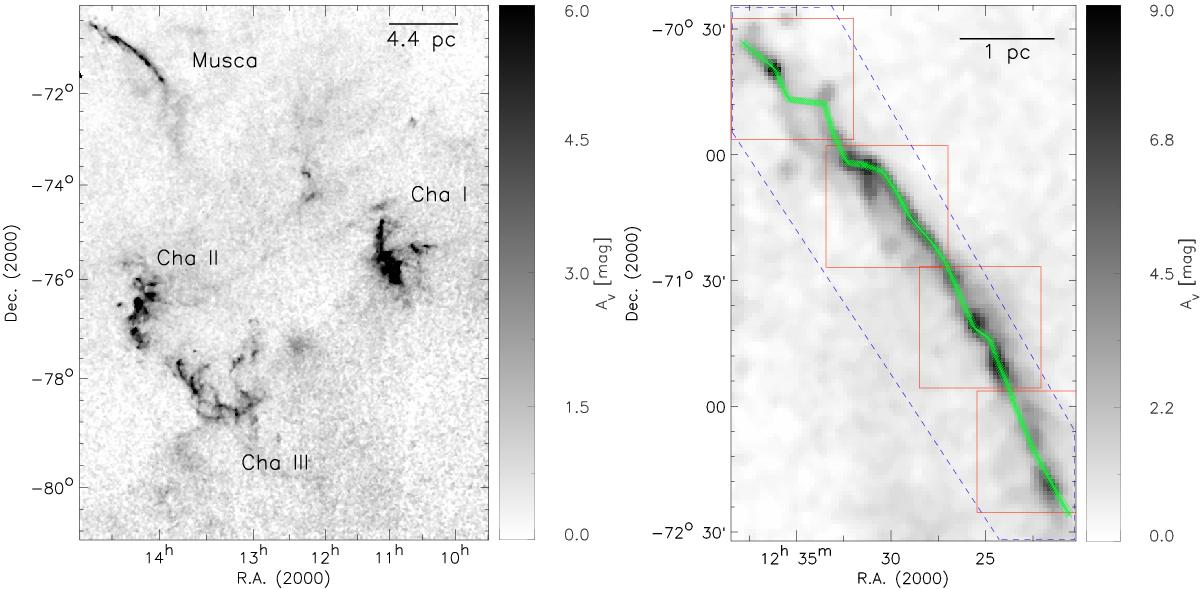
Left: dust extinction map of the Chamaeleon-Musca region, based on 2MASS data (Kainulainen et al. 2009). Right: zoom-in to the Musca cloud, showing the instrument footprints of the observations employed in this work: NEWFIRM/NIR data (red rectangles), LABOCA/870 μm continuum emission (blue dashed lines, approximate coverage), SHeFI/C18O line emission (green crosses, from Hacar et al. 2016).
Current usage metrics show cumulative count of Article Views (full-text article views including HTML views, PDF and ePub downloads, according to the available data) and Abstracts Views on Vision4Press platform.
Data correspond to usage on the plateform after 2015. The current usage metrics is available 48-96 hours after online publication and is updated daily on week days.
Initial download of the metrics may take a while.