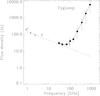
Fig. 5
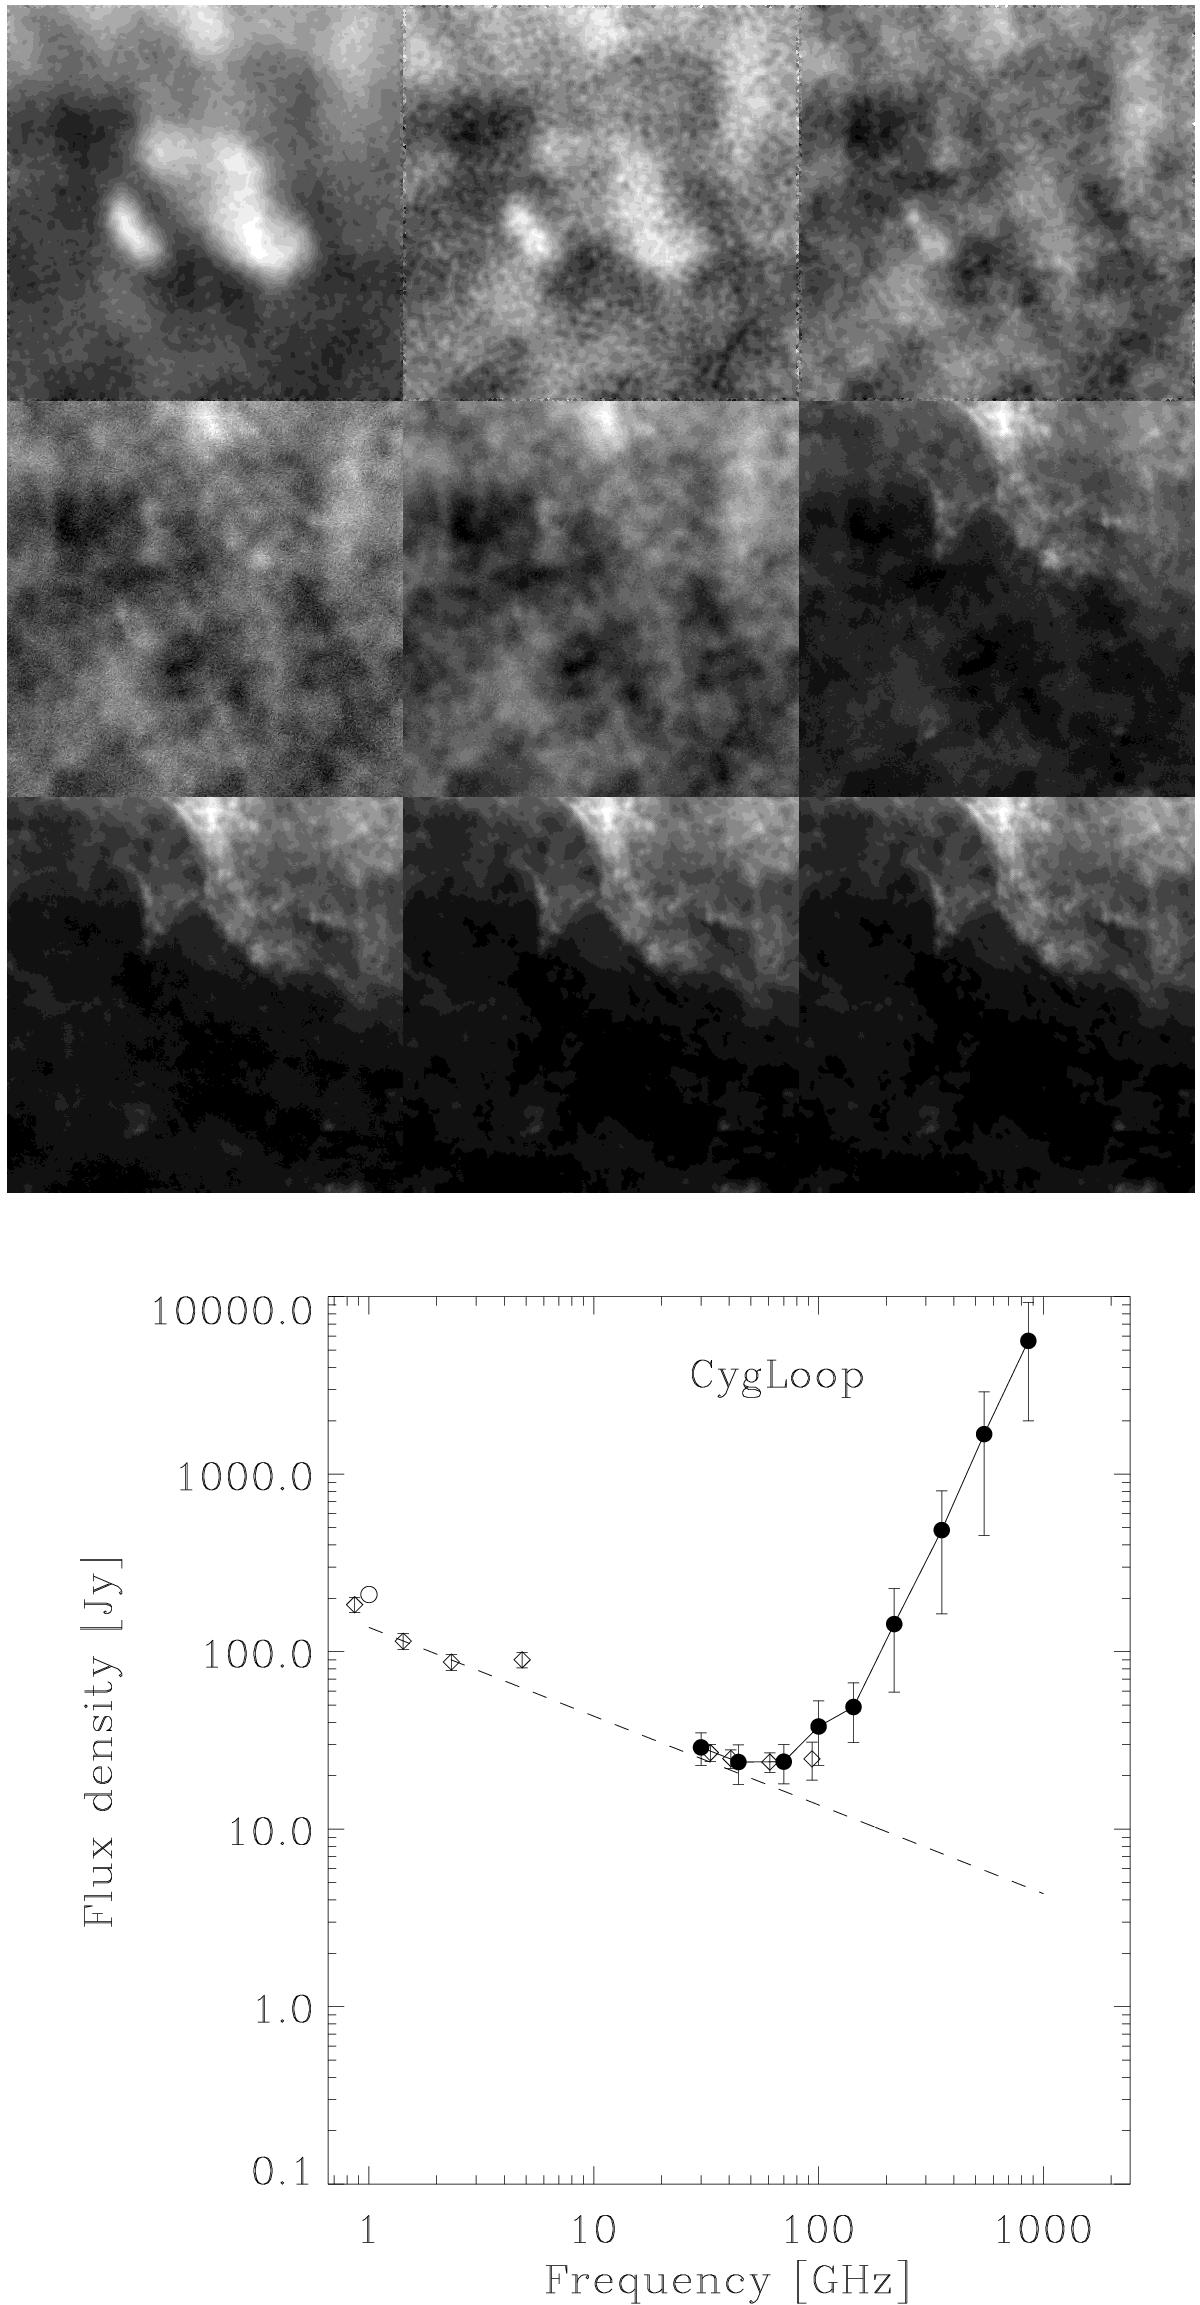
Top: images of the Cygnus Loop environment at the nine Planck frequencies (Table 1), increasing from 30 GHz at top left to 857 GHz at bottom right. Each image is 435′ on a side, with galactic coordinate orientation. The SNR is clearly visible in the lowest-frequency images, but a nearby star-forming region (to the north) confuses the SNR at frequencies above 100 GHz. Bottom: spectral energy distribution of the Cygnus Loop including fluxes measured by us from WMAP using the same apertures as for Planck, and independent measurements from Uyanıker et al. (2004) and Reich et al. (2003). The dashed curve is a power law normalized through the radio fluxes.
Current usage metrics show cumulative count of Article Views (full-text article views including HTML views, PDF and ePub downloads, according to the available data) and Abstracts Views on Vision4Press platform.
Data correspond to usage on the plateform after 2015. The current usage metrics is available 48-96 hours after online publication and is updated daily on week days.
Initial download of the metrics may take a while.