Fig. 4
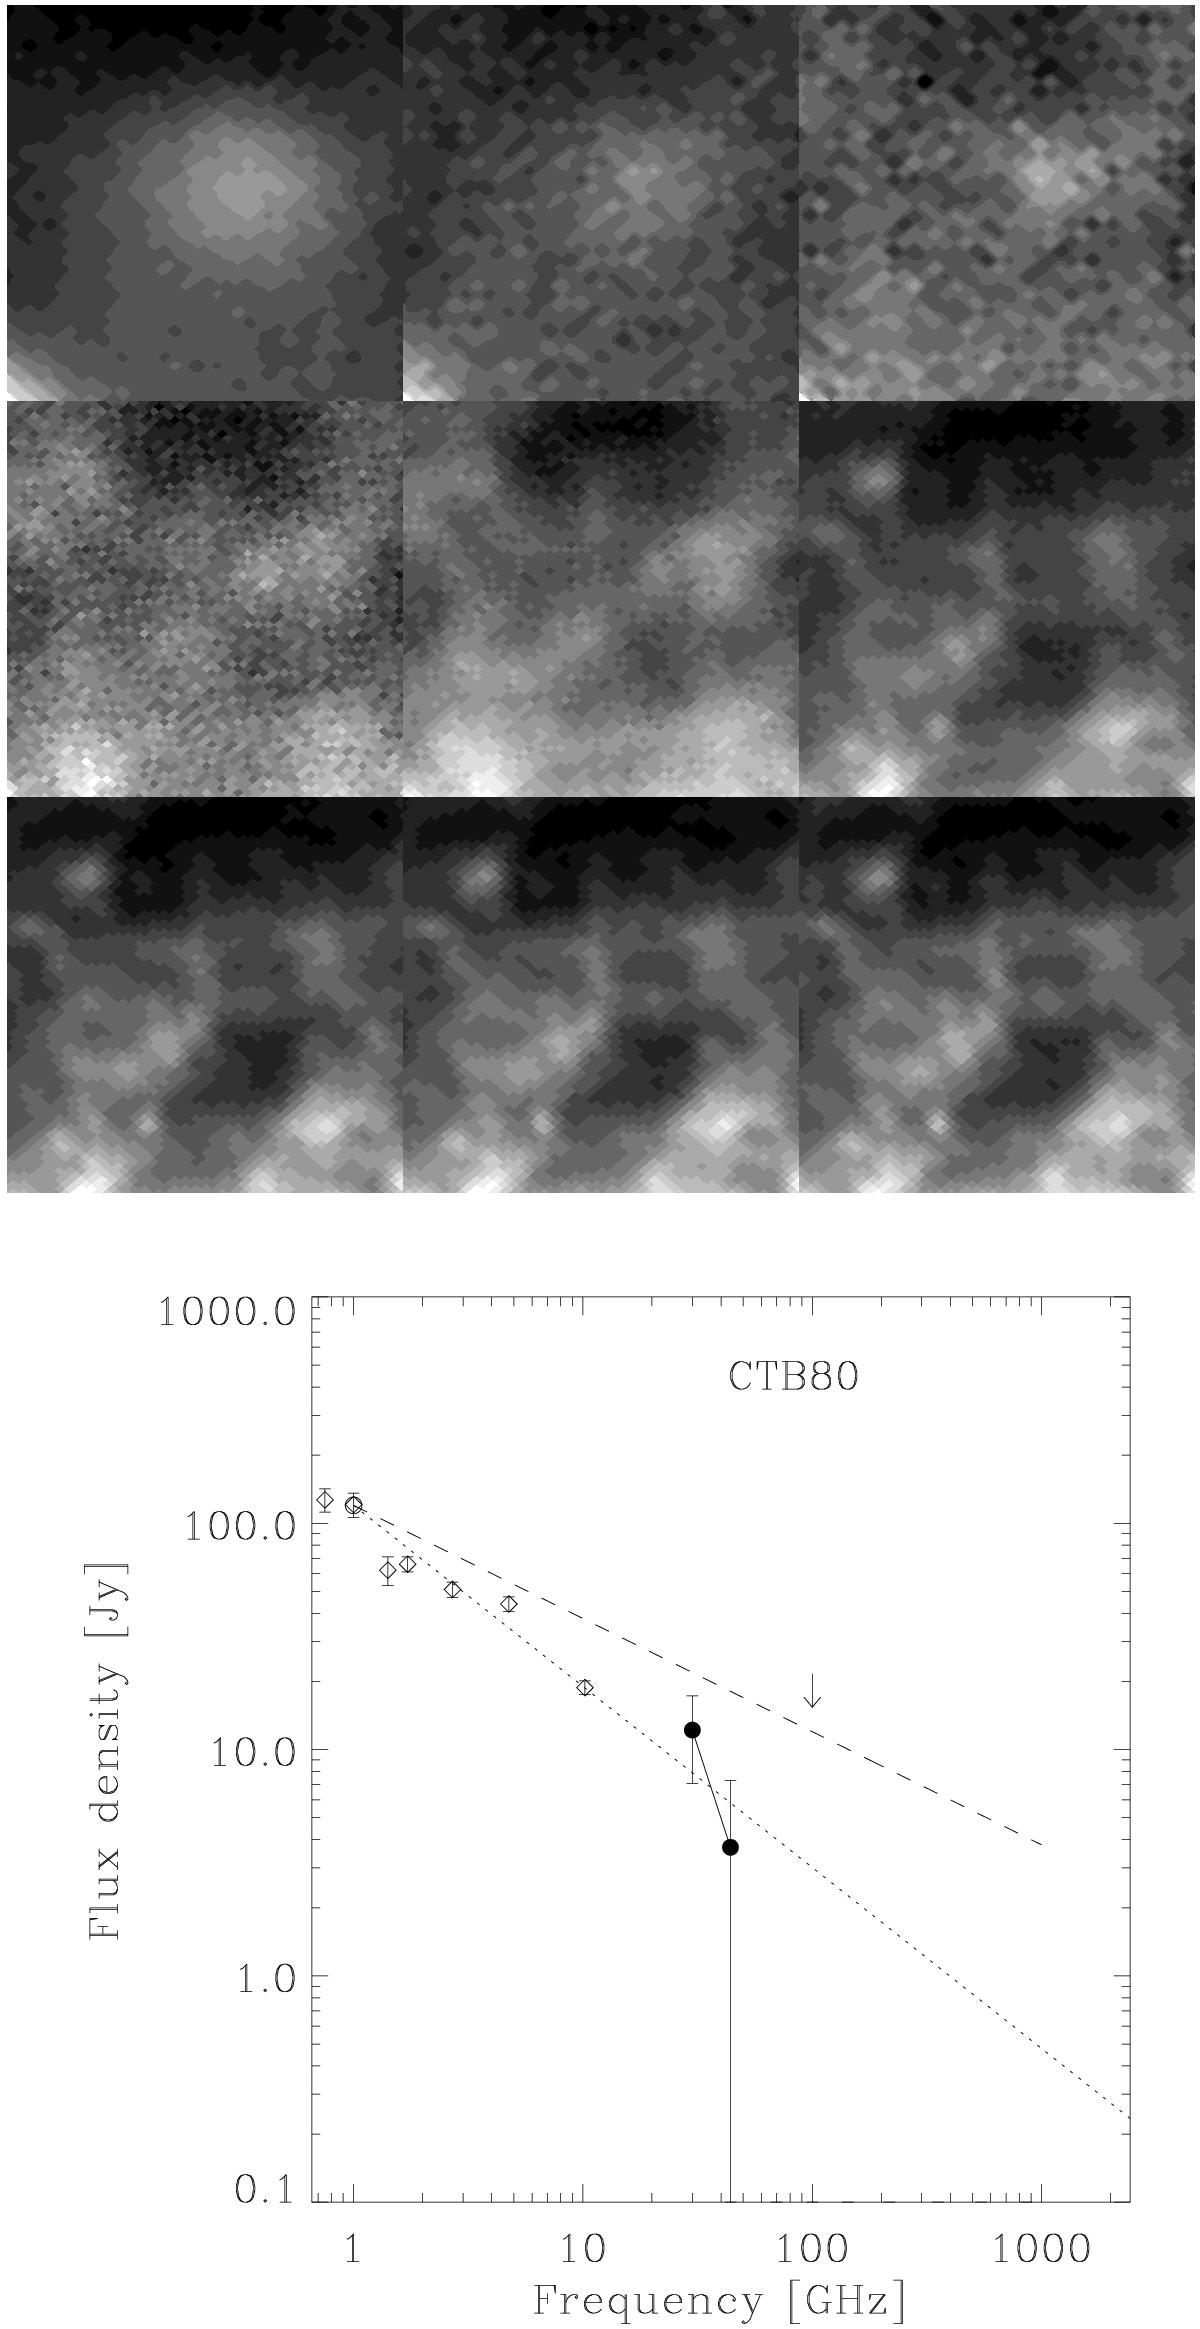
Top: images of the CTB 80 environment at the nine Planck frequencies (Table 1), increasing from 30 GHz at top left to 857 GHz at bottom right. Each image is 100′ on a side, with galactic coordinate orientation. Bottom: microwave SED of CTB 80. Filled circles are Planck measurements from this paper, with 3σ error bars. The open symbol at 1 GHz is from the Green catalogue, and the dashed and dotted line emanating from it are power laws with spectral indices of 0.5 (Green catalogue) and 0.8 (approximate fit for 1–100 GHz), respectively, for illustration. Open diamonds are radio flux densities from Velusamy et al. (1976) at 0.75, 1.00 GHz;Mantovani et al. (1985) at 1.41, 1.72, 2.695 and 4.75 GHz; and Sofue et al. (1983) at 10.2 GHz. The downward arrow shows a flux density measurement that was contaminated by unrelated foreground emission.
Current usage metrics show cumulative count of Article Views (full-text article views including HTML views, PDF and ePub downloads, according to the available data) and Abstracts Views on Vision4Press platform.
Data correspond to usage on the plateform after 2015. The current usage metrics is available 48-96 hours after online publication and is updated daily on week days.
Initial download of the metrics may take a while.