Fig. 18
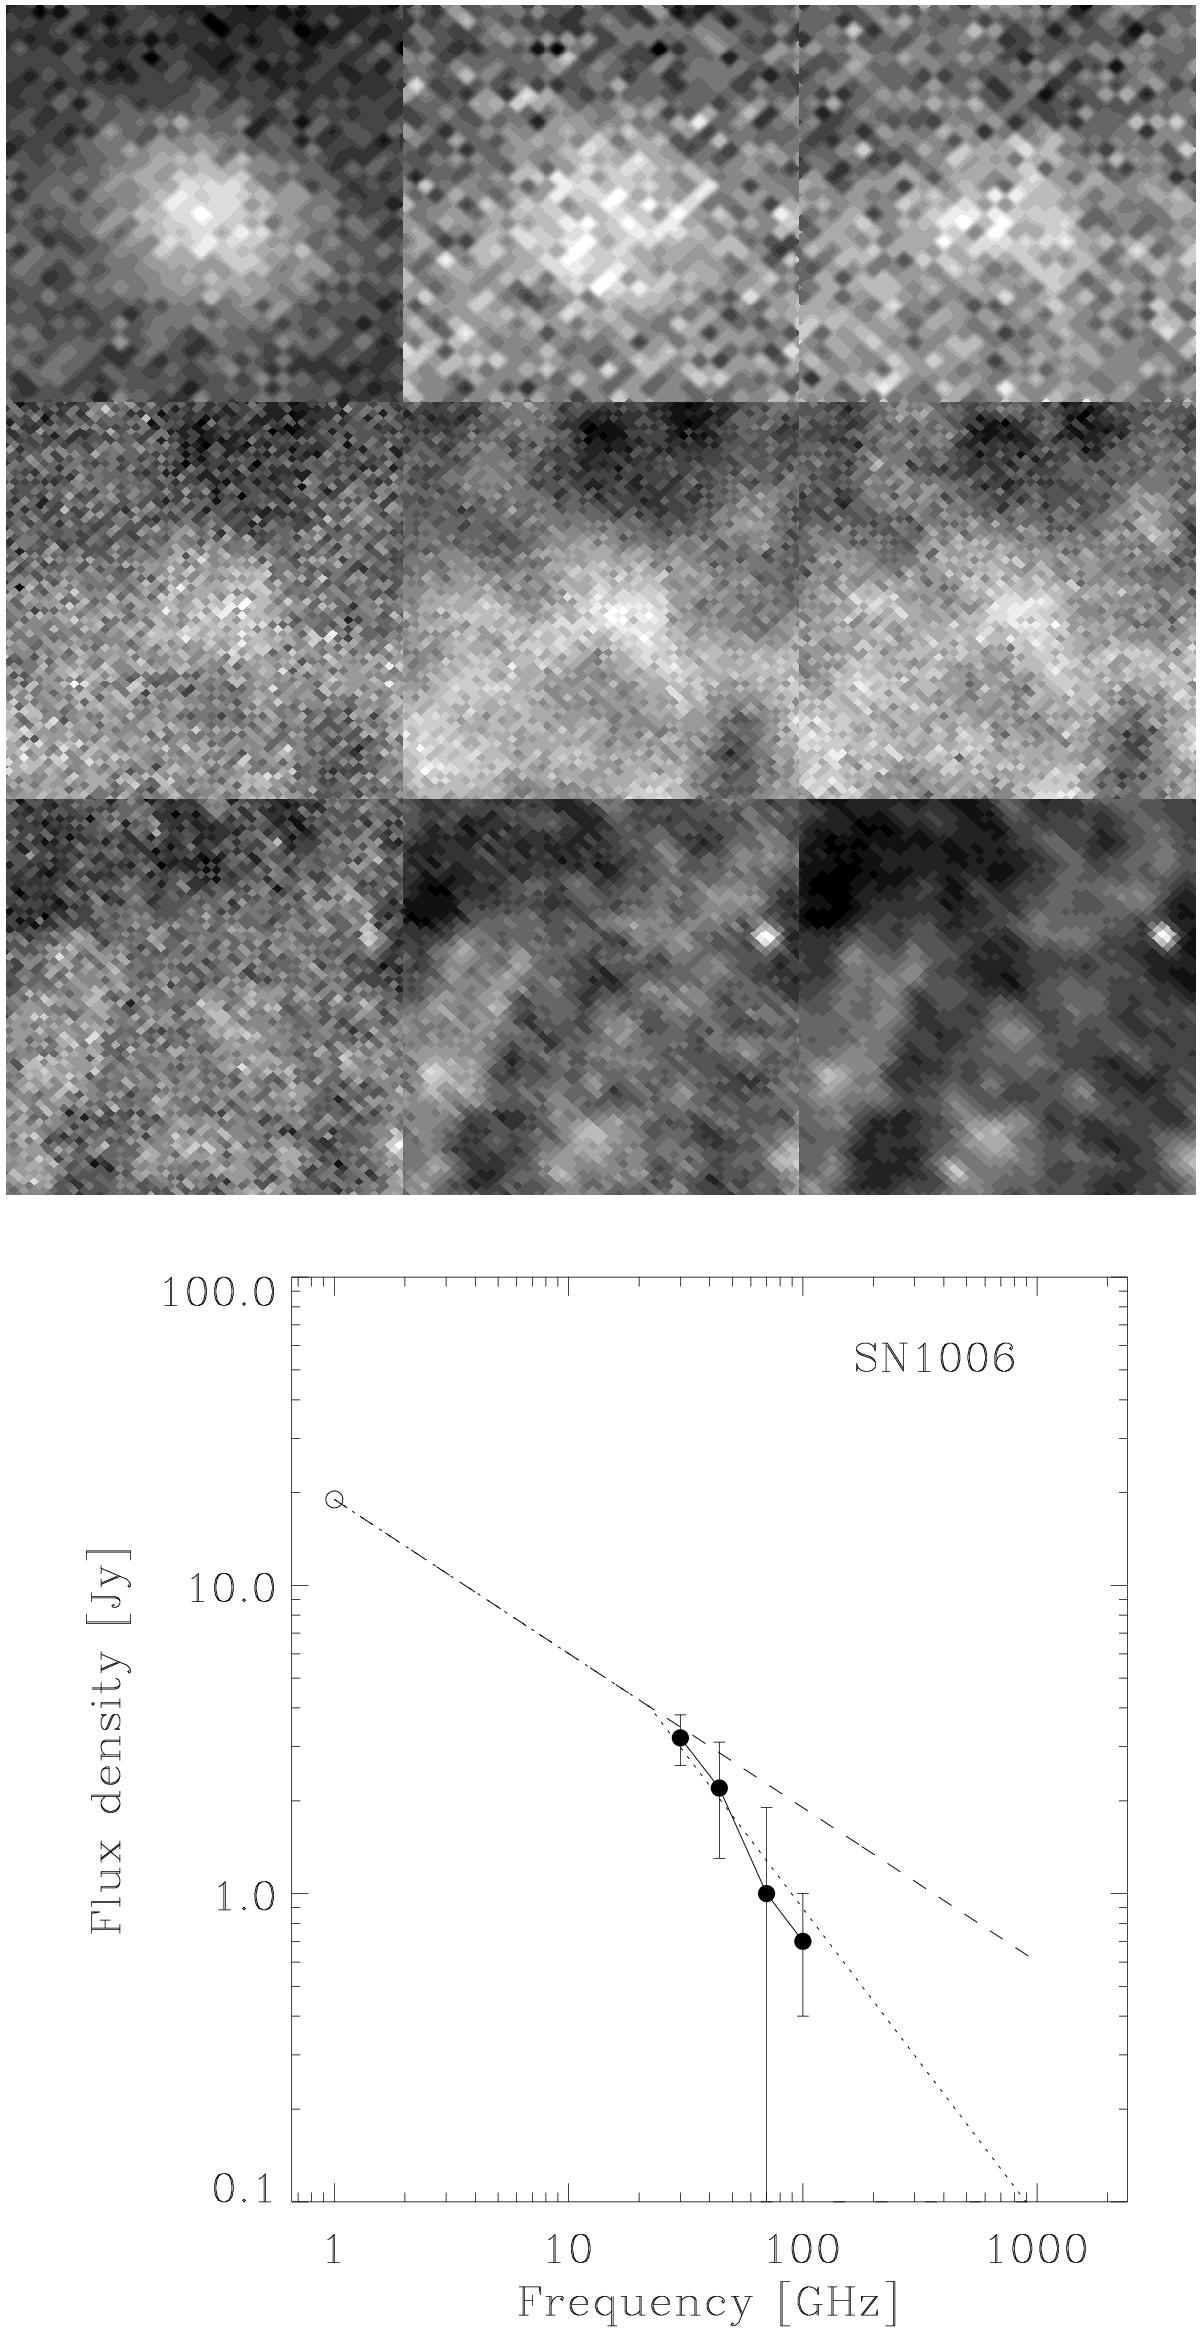
Top: images of the SN 1006 environment at the nine Planck frequencies (Table 1), increasing from 30 GHz at top left to 857 GHz at bottom right. Each image is 100′ on a side, with galactic coordinate orientation. Bottom: microwave SED of SN 1006. Filled circles are Planck measurements from this paper, with 3σ error bars. The open symbol at 1 GHz is from the Green catalogue, and the dashed line emanating from it is a power law with spectral index from the Green catalogue. The dotted line is a broken power-law fit discussed in the text.
Current usage metrics show cumulative count of Article Views (full-text article views including HTML views, PDF and ePub downloads, according to the available data) and Abstracts Views on Vision4Press platform.
Data correspond to usage on the plateform after 2015. The current usage metrics is available 48-96 hours after online publication and is updated daily on week days.
Initial download of the metrics may take a while.