Fig. 11
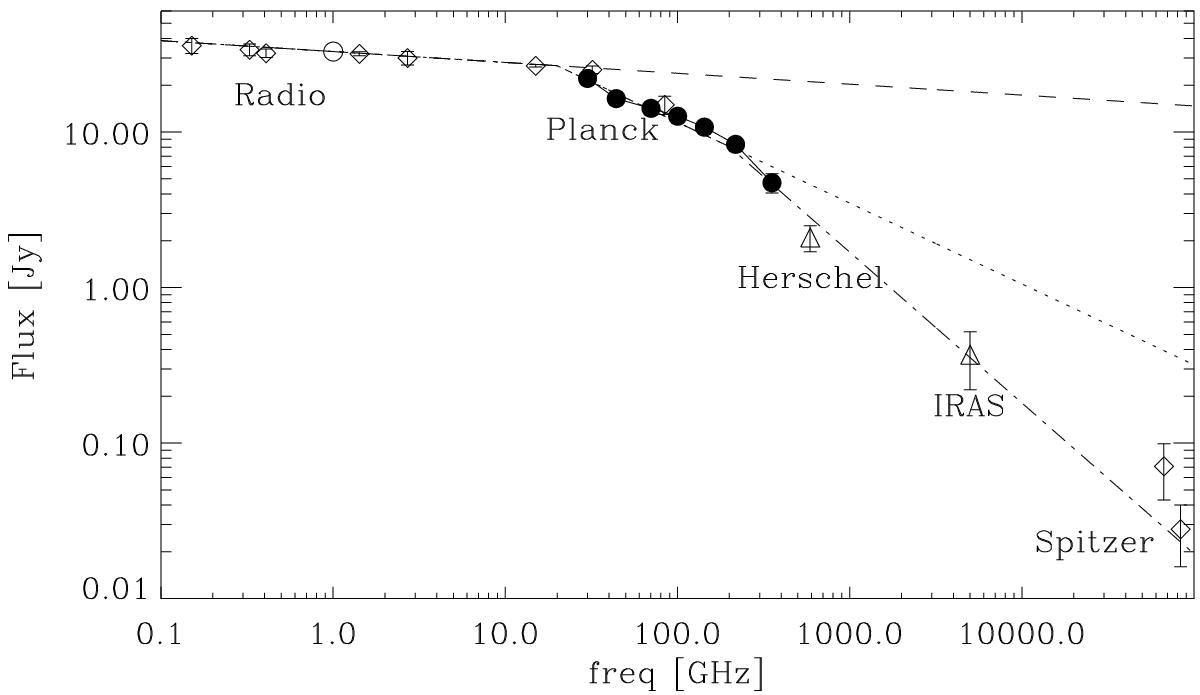
Microwave SED of 3C 58 from the radio through infrared. Data are as in Fig. 9 with the addition of lower-frequency radio flux densities (Green 2009) and higher-frequency IRAS and Spitzer flux densities, and omission of the ERCSC flux densities. The dashed line is the power-law fit to the radio flux densities; the dotted line is the pulsar wind nebula model; and the dash-dotted line is that model with the addition of a second break with spectral index 0.92 above 200 GHz.
Current usage metrics show cumulative count of Article Views (full-text article views including HTML views, PDF and ePub downloads, according to the available data) and Abstracts Views on Vision4Press platform.
Data correspond to usage on the plateform after 2015. The current usage metrics is available 48-96 hours after online publication and is updated daily on week days.
Initial download of the metrics may take a while.