Fig. 1
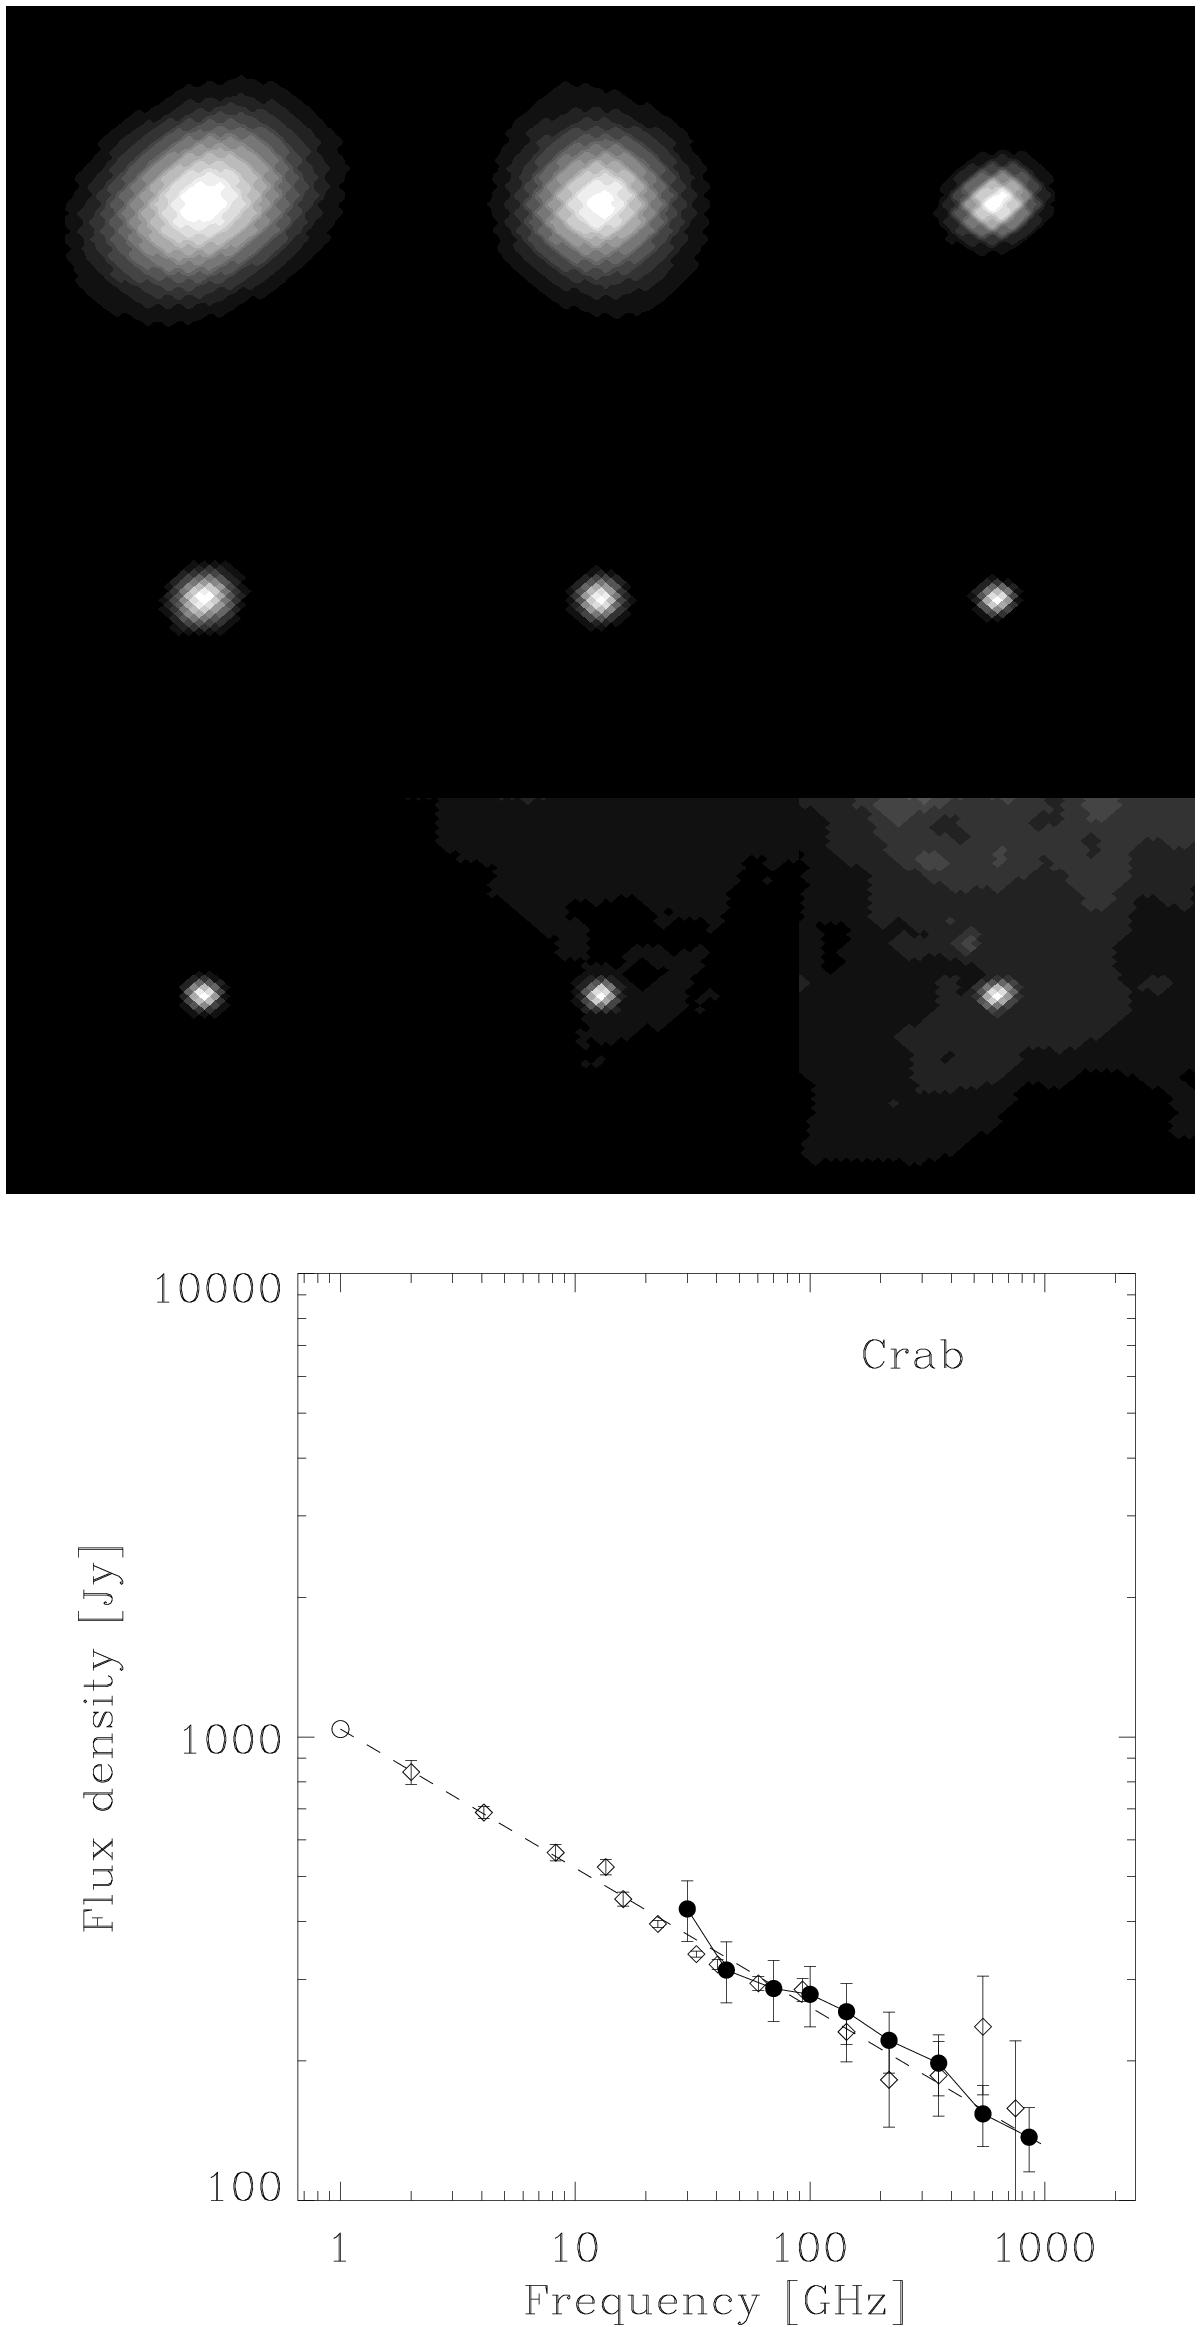
Top: Planck Images of the Crab nebula at frequencies increasing from 30 GHz at top left to 857 GHz at bottom right. Each image is 100′ on a side, with the three lowest-frequency images smoothed by 7′. Bottom: microwave spectral energy distribution of the Crab Nebula. Filled circles are Planck measurements with 3σ error bars. The open symbol at 1 GHz and the dashed line emanating from it are the flux and power law with spectral index from the Green catalogue. Open diamonds are from the compilation of flux densities by Macías-Pérez et al. (2010).
Current usage metrics show cumulative count of Article Views (full-text article views including HTML views, PDF and ePub downloads, according to the available data) and Abstracts Views on Vision4Press platform.
Data correspond to usage on the plateform after 2015. The current usage metrics is available 48-96 hours after online publication and is updated daily on week days.
Initial download of the metrics may take a while.