Free Access
Fig. 2
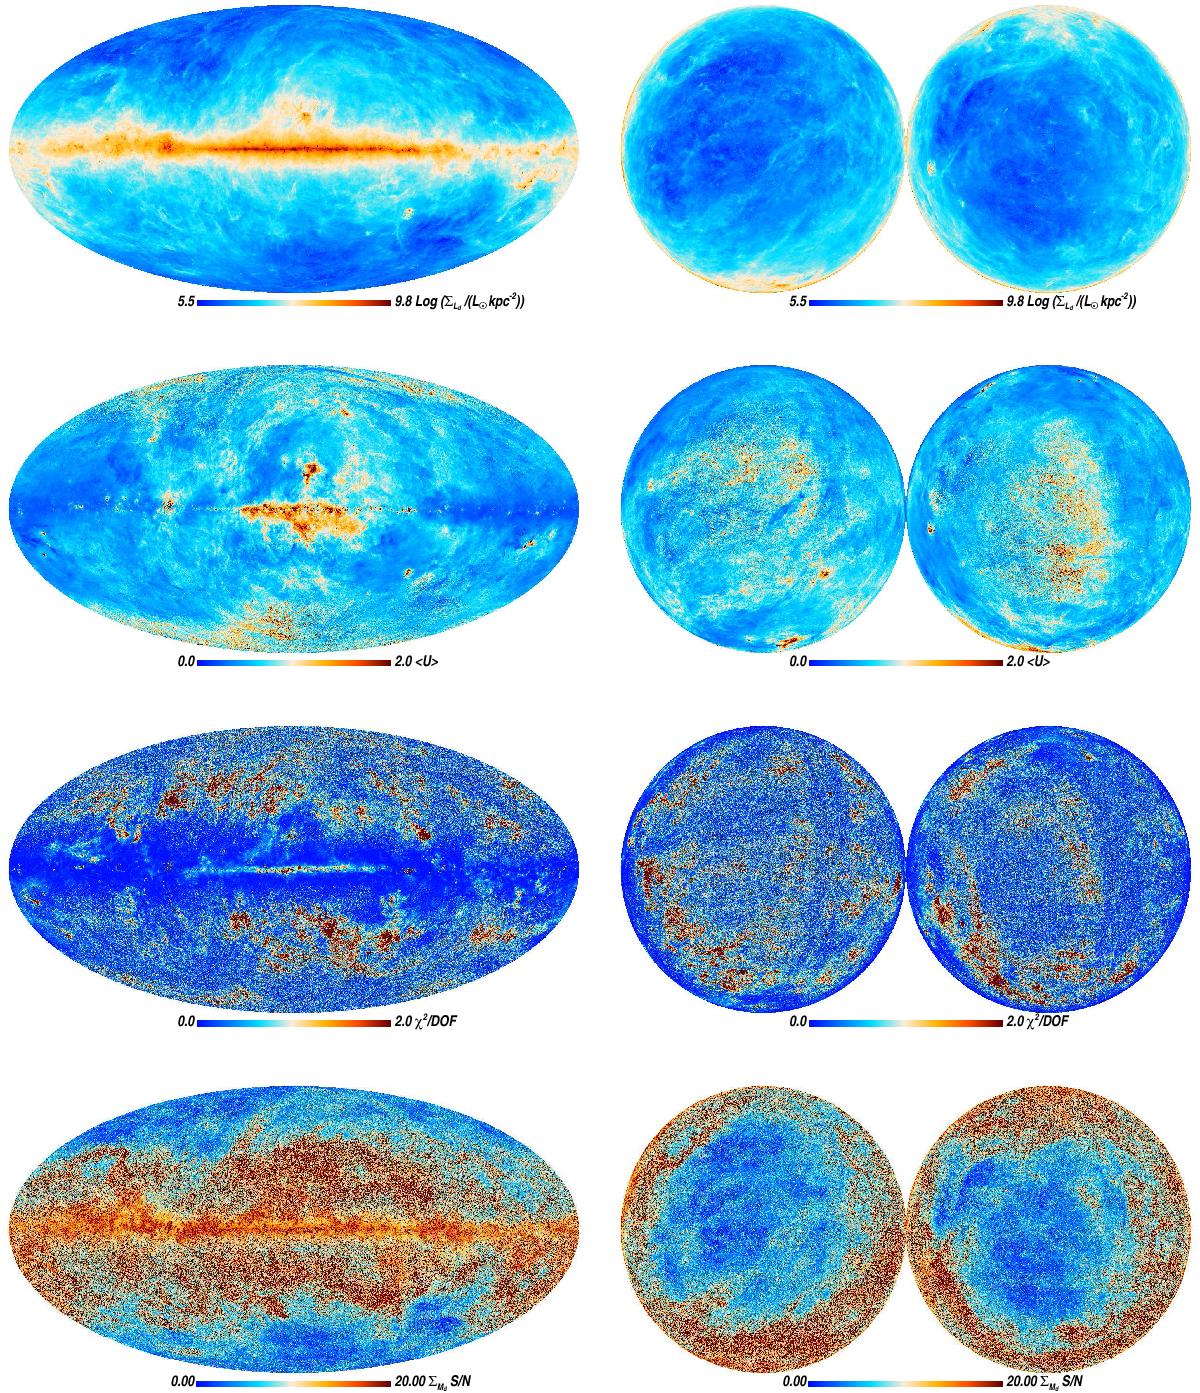
DL derived parameters. The top row corresponds to the dust luminosity surface density, ΣLd, the second row shows the mean intensity heating the dust, ⟨ U ⟩, the third row shows the χ2 per degree of freedom of the fit, χ2/ N.d.o.f., and the bottom row the S/N map of the dust mass surface density ΣMd.
Current usage metrics show cumulative count of Article Views (full-text article views including HTML views, PDF and ePub downloads, according to the available data) and Abstracts Views on Vision4Press platform.
Data correspond to usage on the plateform after 2015. The current usage metrics is available 48-96 hours after online publication and is updated daily on week days.
Initial download of the metrics may take a while.