Fig. 1
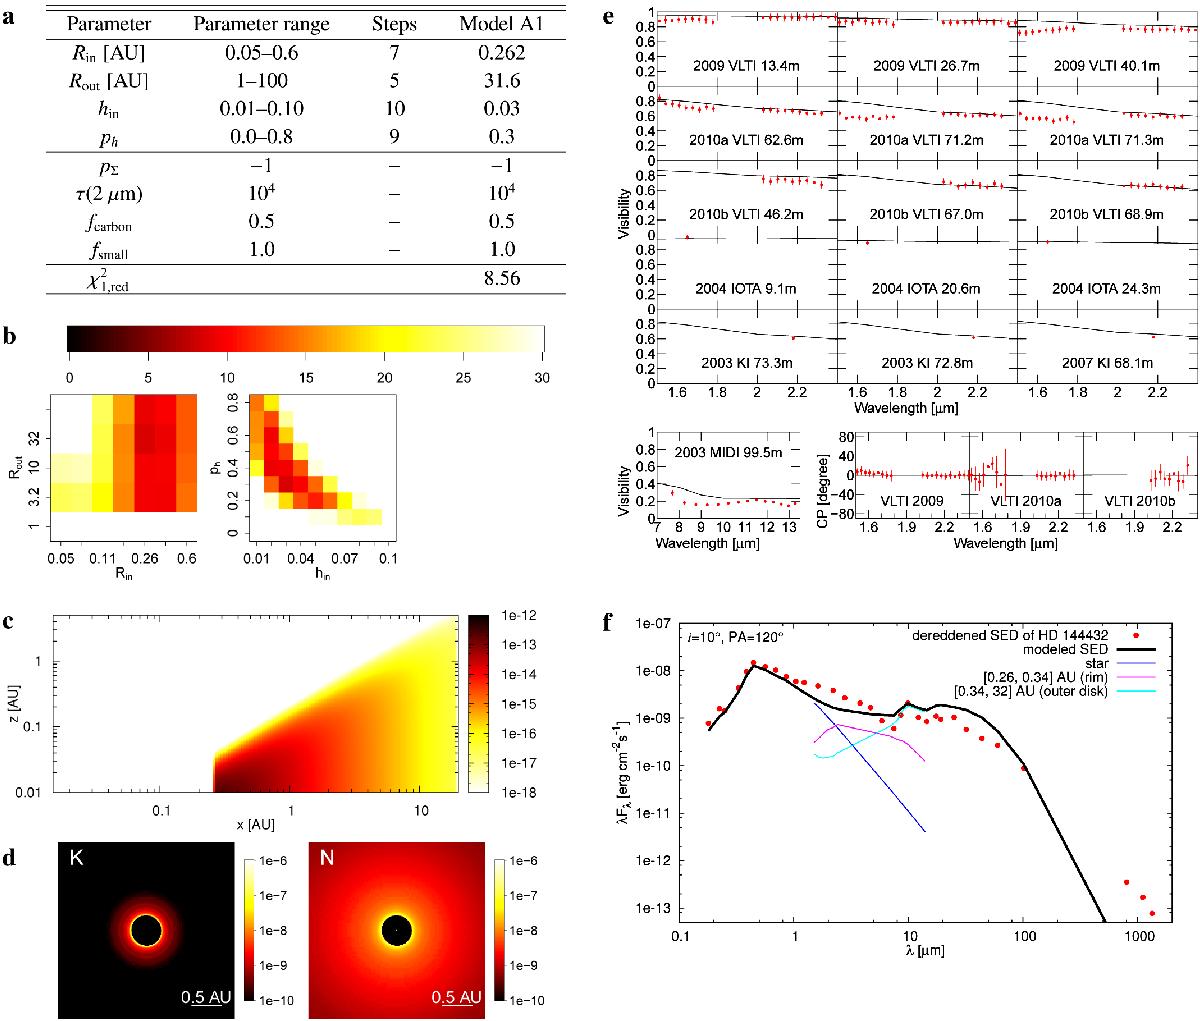
Model scanning run A (simple one-component disks), and the model parameters of the best model A1 with minimum ![]() , which is calculated by comparing each model with data set 1. a: parameter ranges of model scanning run A, number of tested parameter values (steps) per parameter, and parameters of the best model A1. The listed parameters are: Rin = inner radius of the disk, Rout = outer radius of the disk, hin = scale height at inner radius, ph = scale-height power-law index, pΣ = surface-density power-law index, τ(2 μm) = midplane optical depth at 2 μm, fsmall = fraction of small grains in the dust, fcarbon = fraction of carbon in the dust. b:
, which is calculated by comparing each model with data set 1. a: parameter ranges of model scanning run A, number of tested parameter values (steps) per parameter, and parameters of the best model A1. The listed parameters are: Rin = inner radius of the disk, Rout = outer radius of the disk, hin = scale height at inner radius, ph = scale-height power-law index, pΣ = surface-density power-law index, τ(2 μm) = midplane optical depth at 2 μm, fsmall = fraction of small grains in the dust, fcarbon = fraction of carbon in the dust. b: ![]() maps of Model run A. For each subset of parameters, the
maps of Model run A. For each subset of parameters, the ![]() shown is the lowest value for all combinations with other parameters. For example, for each pair of (Rin, Rout) values, the
shown is the lowest value for all combinations with other parameters. For example, for each pair of (Rin, Rout) values, the ![]() values for all possible (hin, ph) combinations within the described ranges were compared and the minimum value found is plotted into the map at left panel. c: the dust density distribution of the model, in units of g cm-3. d: K- (left) and N-band (right) model images A1, in units of erg cm-2 s-1 Hz-1. e: NIR and MIR visibilities, and closure phases CP (red dots: observations; black lines: model). The VLTI data are our own data. The data sets 2004 IOTA, 2003 KI, 2007 KI, and 2003 MIDI mentioned in the panels are taken from Monnier et al. (2006, 2005), Eisner et al. (2009), and Leinert et al. (2004), respectively. f: SED (from Leinert et al. 2004). The lines denote the model contributions from different radial regions. The red dots are the observations.
values for all possible (hin, ph) combinations within the described ranges were compared and the minimum value found is plotted into the map at left panel. c: the dust density distribution of the model, in units of g cm-3. d: K- (left) and N-band (right) model images A1, in units of erg cm-2 s-1 Hz-1. e: NIR and MIR visibilities, and closure phases CP (red dots: observations; black lines: model). The VLTI data are our own data. The data sets 2004 IOTA, 2003 KI, 2007 KI, and 2003 MIDI mentioned in the panels are taken from Monnier et al. (2006, 2005), Eisner et al. (2009), and Leinert et al. (2004), respectively. f: SED (from Leinert et al. 2004). The lines denote the model contributions from different radial regions. The red dots are the observations.
Current usage metrics show cumulative count of Article Views (full-text article views including HTML views, PDF and ePub downloads, according to the available data) and Abstracts Views on Vision4Press platform.
Data correspond to usage on the plateform after 2015. The current usage metrics is available 48-96 hours after online publication and is updated daily on week days.
Initial download of the metrics may take a while.