Free Access
Fig. A.2
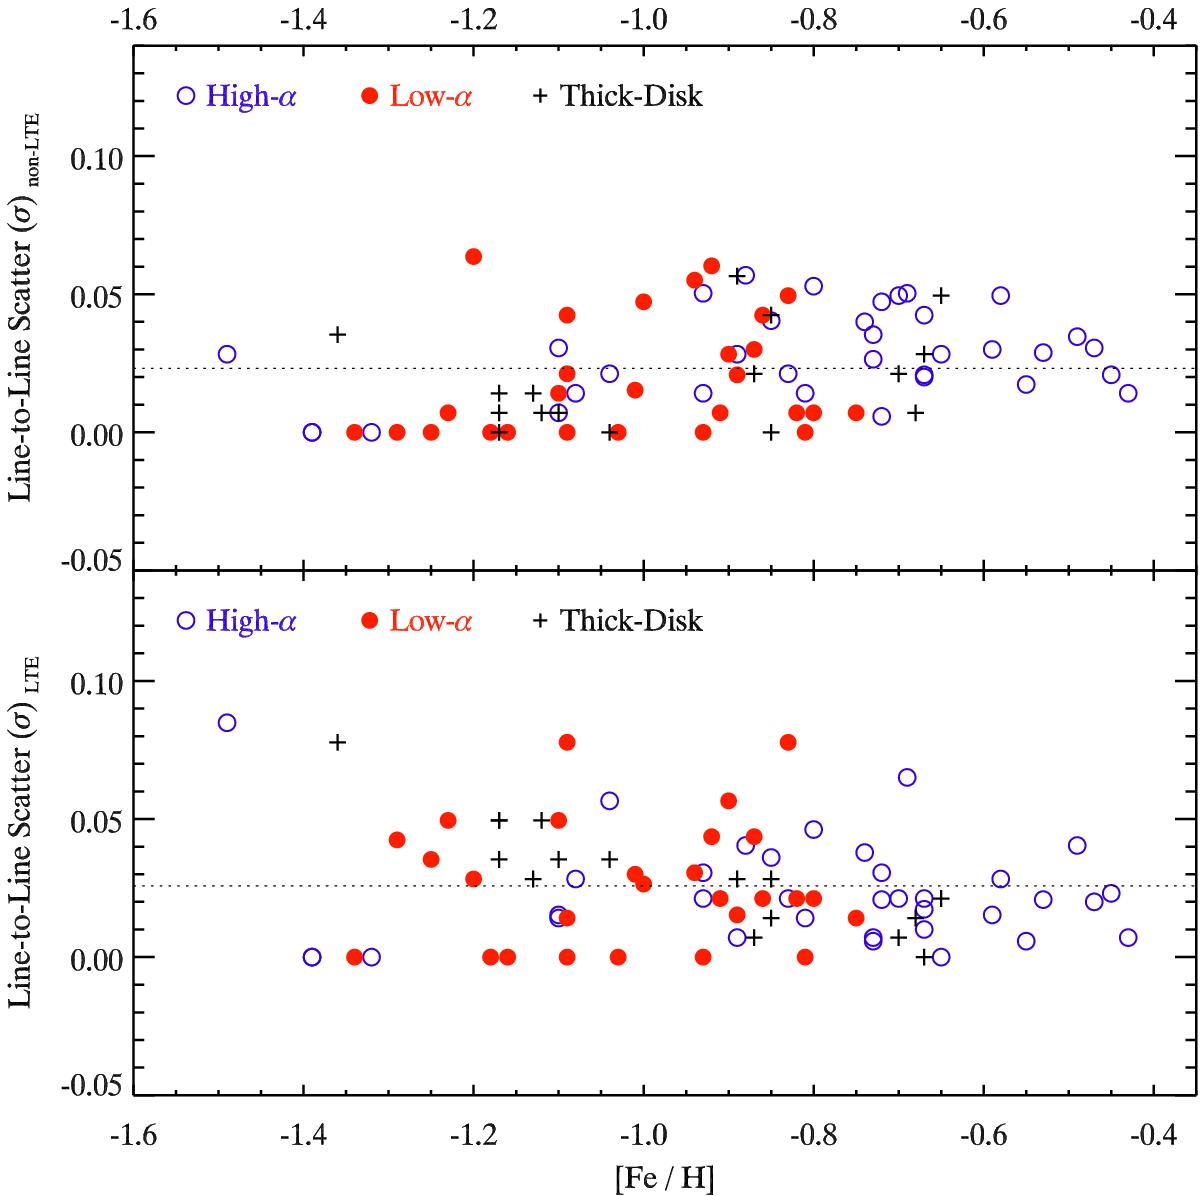
Distribution of line-to-line scatter as a function of metallicity for LTE abundances (bottom panel) and non-LTE abundances (top panel). The stars whose copper abundances were derived by only one line are not plotted in the figure. The symbols are as same as in Fig. 2.
Current usage metrics show cumulative count of Article Views (full-text article views including HTML views, PDF and ePub downloads, according to the available data) and Abstracts Views on Vision4Press platform.
Data correspond to usage on the plateform after 2015. The current usage metrics is available 48-96 hours after online publication and is updated daily on week days.
Initial download of the metrics may take a while.