Fig. 3
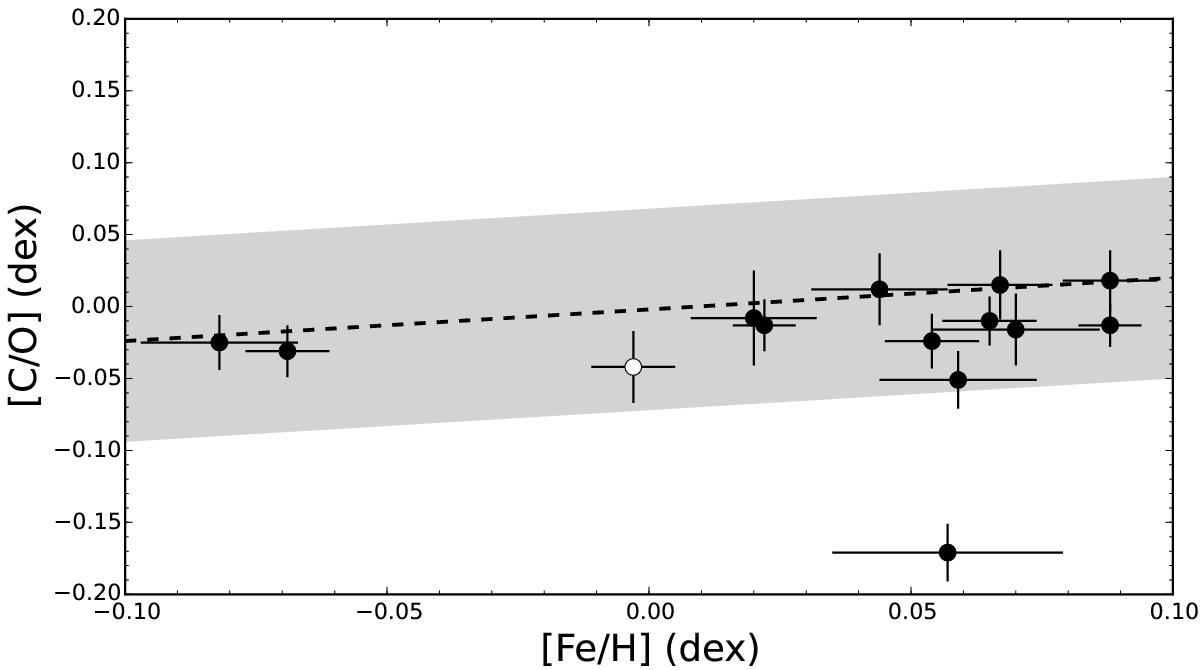
[C/O] ratios as a function of [Fe/H] for the whole sample of solar twins. The symbols are the same as in Fig. 1, where the empty circle corresponds to the HD 112257 star. The linear relation between the [C/O] ratios and [Fe/H] fitted by N15 is plotted as a dashed line, while the grey band represents the one-sigma dispersion around the fit using the data set of Takeda & Honda (2005). The star with the anomalously low C abundance is HD 43162.
Current usage metrics show cumulative count of Article Views (full-text article views including HTML views, PDF and ePub downloads, according to the available data) and Abstracts Views on Vision4Press platform.
Data correspond to usage on the plateform after 2015. The current usage metrics is available 48-96 hours after online publication and is updated daily on week days.
Initial download of the metrics may take a while.