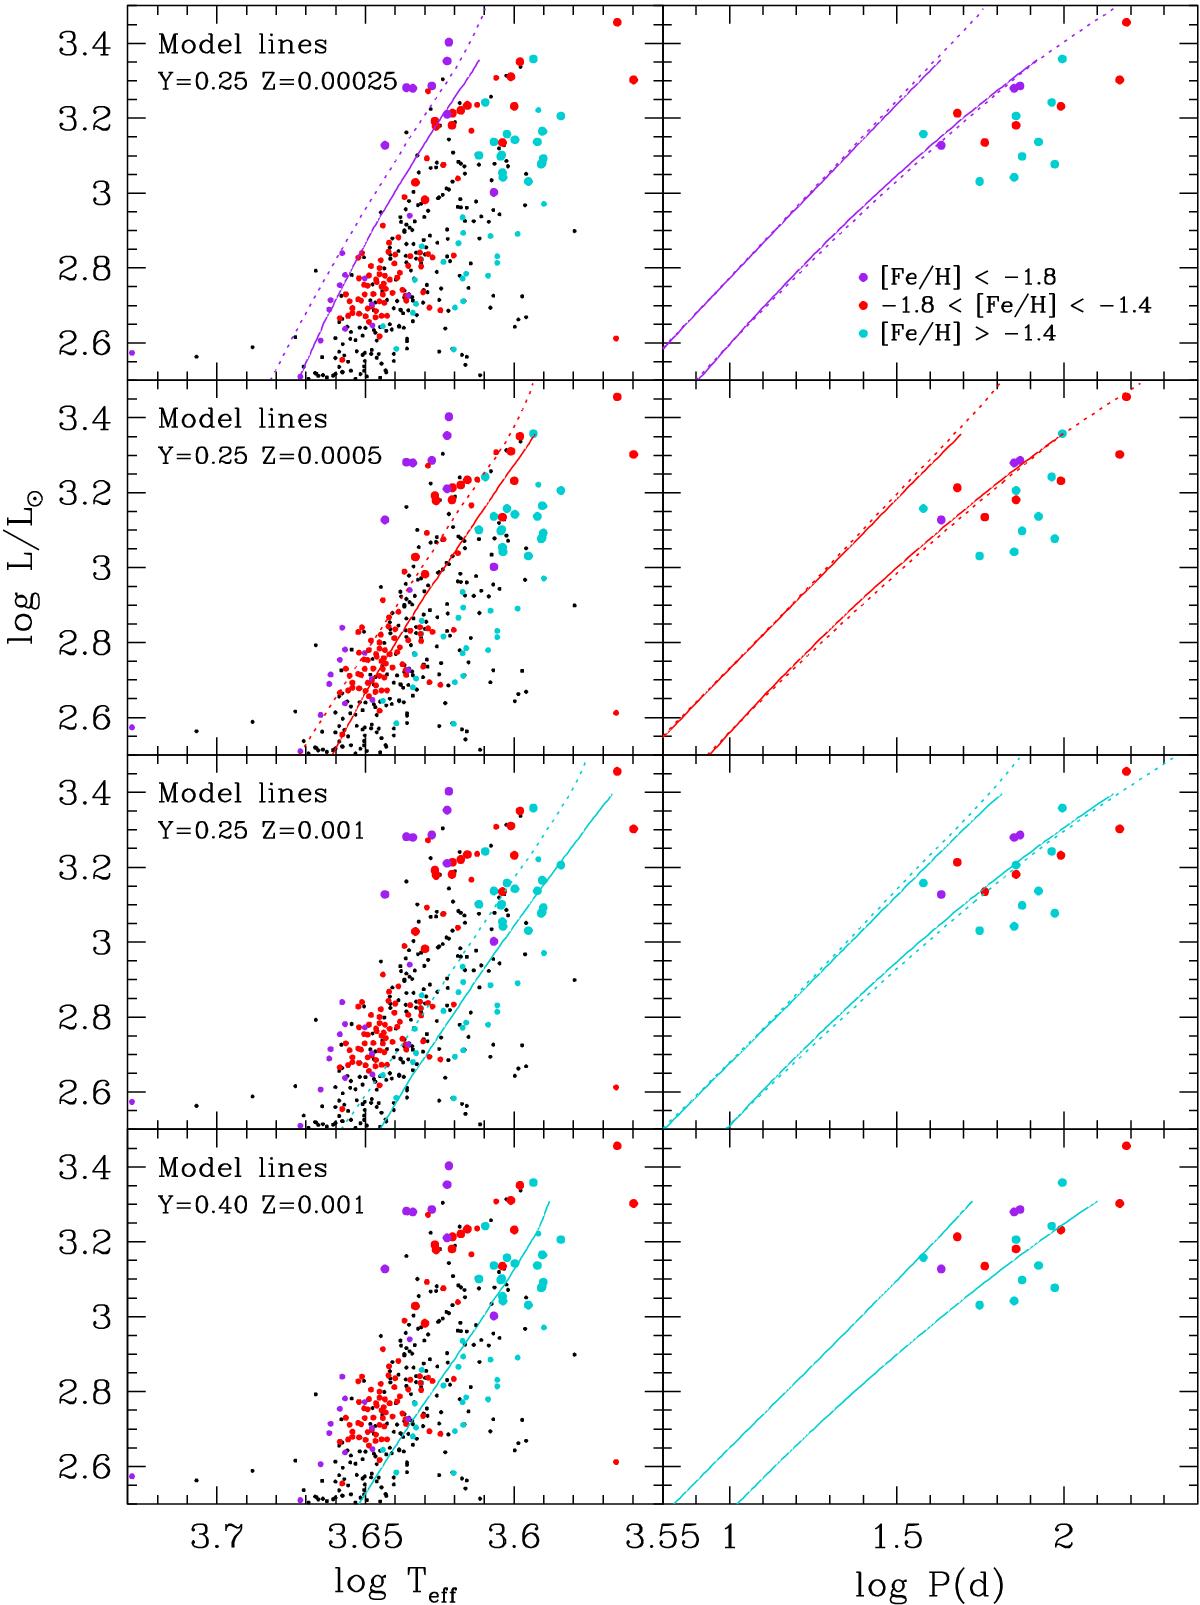
Fig. 5

(log Teff, log L) and (log P, log L) diagrams for stars in ω Cen (points) along with model fits to the diagrams (lines). The point colours are as in Fig. 4 and the abundances used to compute the model lines are shown in the panels at each vertical level. Solid lines are for stars on the RGB and dotted lines are for stars on the AGB. Note that models with abundances given in the bottom panels do not reach the AGB. In the right panels, lines corresponding to the radial fundamental and first-overtone modes are shown.
Current usage metrics show cumulative count of Article Views (full-text article views including HTML views, PDF and ePub downloads, according to the available data) and Abstracts Views on Vision4Press platform.
Data correspond to usage on the plateform after 2015. The current usage metrics is available 48-96 hours after online publication and is updated daily on week days.
Initial download of the metrics may take a while.


