Free Access
Fig. 1
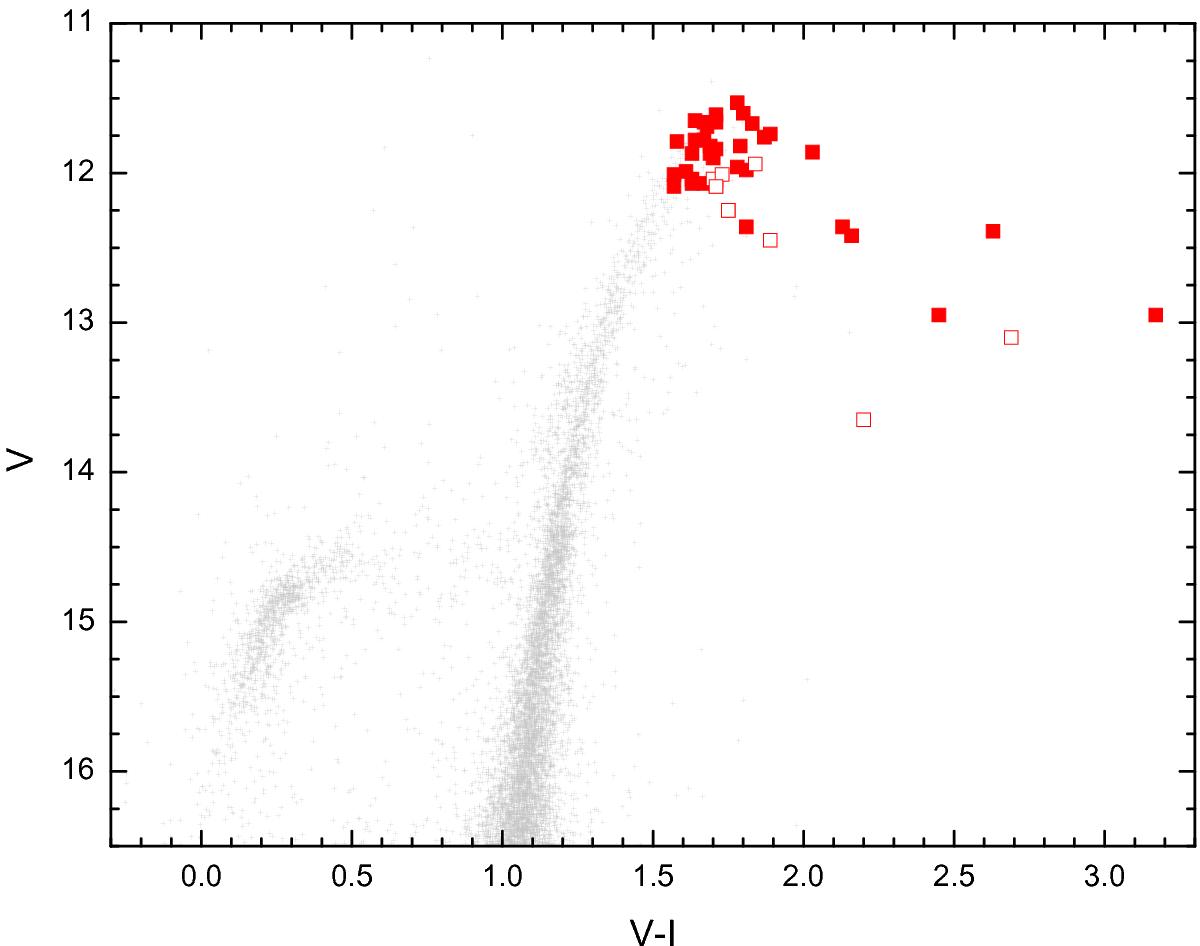
V vs. V − I colour–magnitude diagram for stars in our observed field of ω Cen, using our values of V and I. LPVs (from Table 1) are marked by solid red squares. LPVs outside our observed field (from Table 2) are shown as open squares, using V and I values from Bellini et al. (2009).
Current usage metrics show cumulative count of Article Views (full-text article views including HTML views, PDF and ePub downloads, according to the available data) and Abstracts Views on Vision4Press platform.
Data correspond to usage on the plateform after 2015. The current usage metrics is available 48-96 hours after online publication and is updated daily on week days.
Initial download of the metrics may take a while.