Free Access
Fig. 1
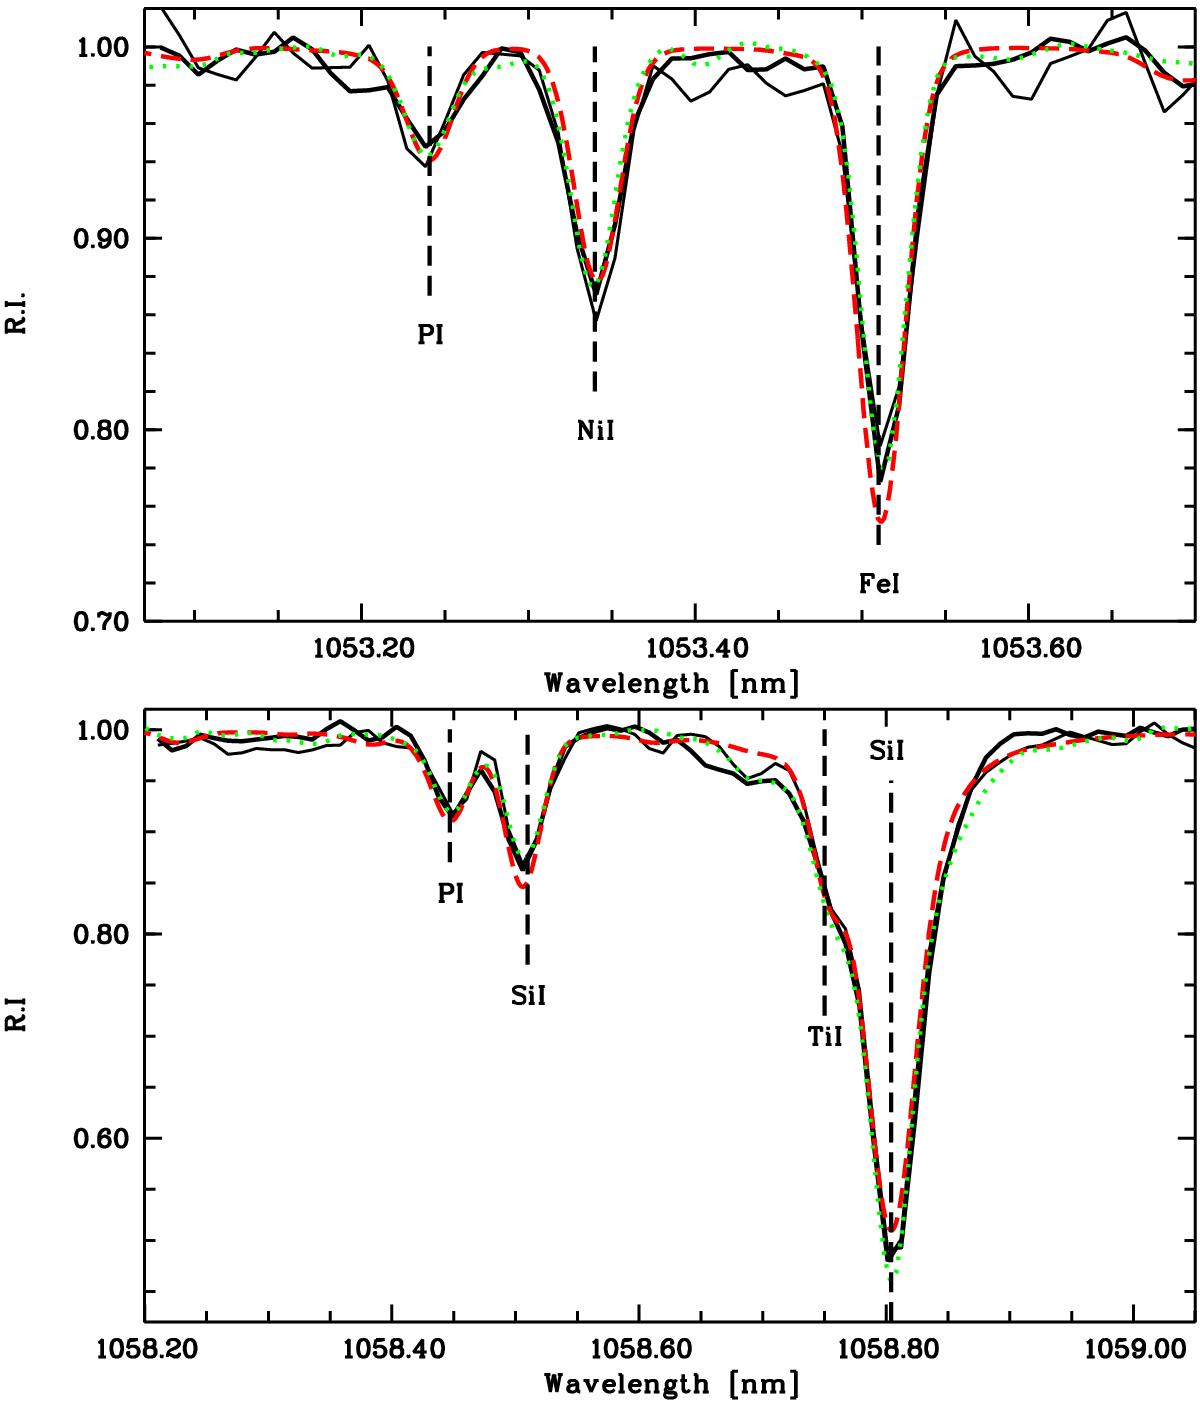
Two P i lines (solid black line thinner and thicker for order 72 and 73, respectively) in the case of HD 1461, in comparison with a synthetic spectrum with A(P) = 5.60 (dashed red). The CRIRES spectrum is also over-plotted (dotted green) degraded at the resolution of GIANO.
Current usage metrics show cumulative count of Article Views (full-text article views including HTML views, PDF and ePub downloads, according to the available data) and Abstracts Views on Vision4Press platform.
Data correspond to usage on the plateform after 2015. The current usage metrics is available 48-96 hours after online publication and is updated daily on week days.
Initial download of the metrics may take a while.