Fig. 9
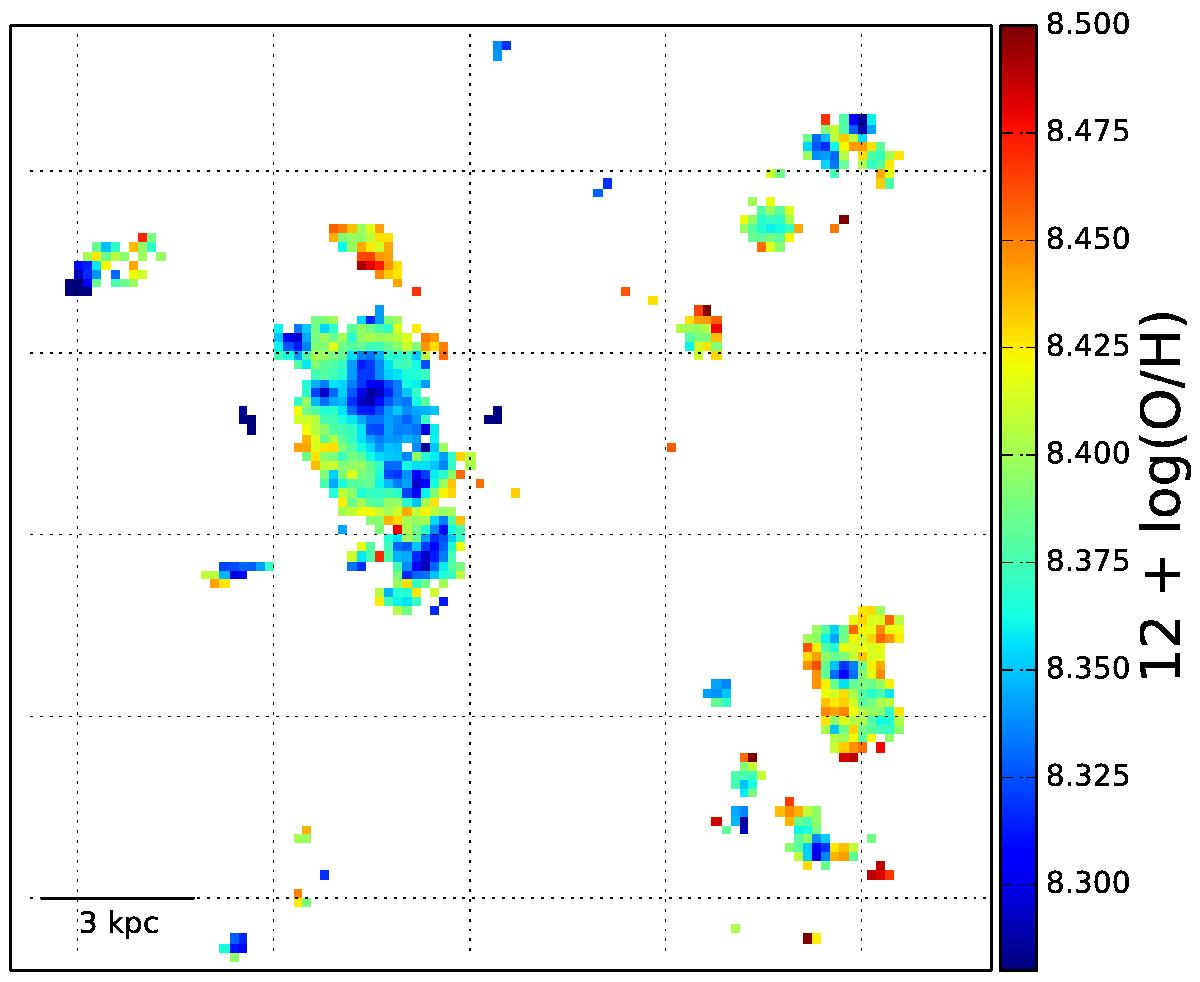
Metallicity map estimated from O3N2 and the calibration of Marino et al. (2013). An outside-in gradient is observed, but the difference between the lowest and the highest abundance can be consistent with an homogeneous abundance distribution and be caused by the variation in other parameters, such as ionization. The field of view is the same as in Fig. 3.
Current usage metrics show cumulative count of Article Views (full-text article views including HTML views, PDF and ePub downloads, according to the available data) and Abstracts Views on Vision4Press platform.
Data correspond to usage on the plateform after 2015. The current usage metrics is available 48-96 hours after online publication and is updated daily on week days.
Initial download of the metrics may take a while.