Fig. 7
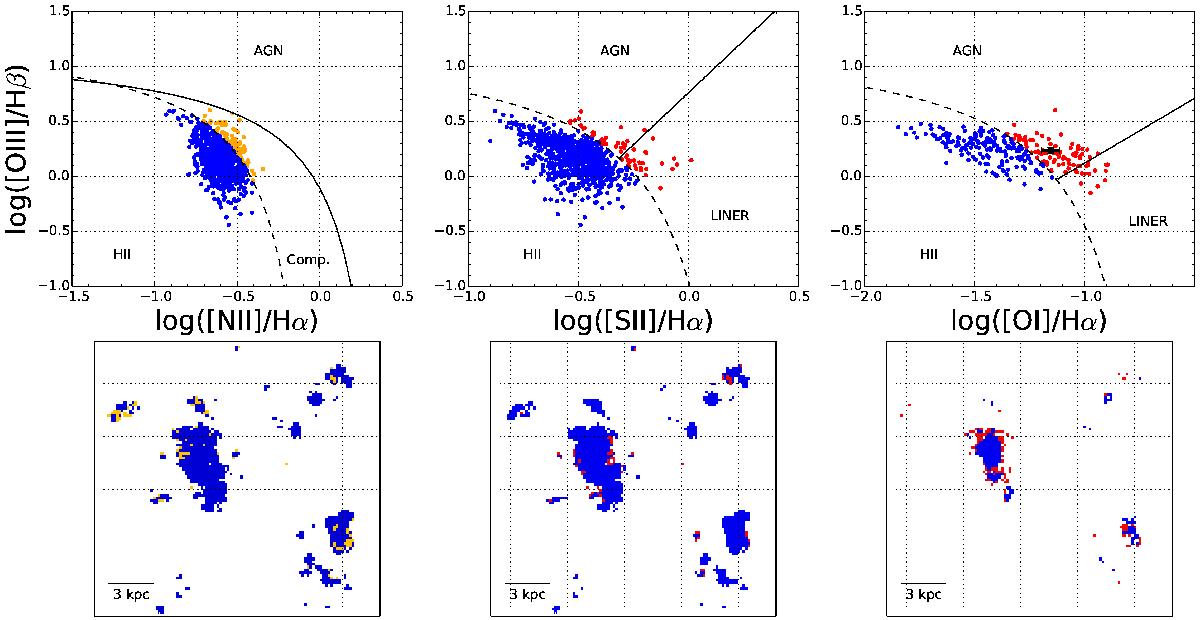
BPT diagnostics for different emission line ratios. On the [OIII]/Hβ vs. [NII]/Hα diagram, the dotted line delineates the pure starburst region, as defined by Kauffmann et al. (2003) using a set of Sloan Digital Sky Survey (SDSS) spectra. The spaxels belonging to this region are shown in blue, those outside it in orange. The solid line traces the upper theoretical limit to pure H ii regions measured by Kewley et al. (2001). For the other diagrams, the dashed lines defined by Kewley et al. (2006) separate the starburst (blue points) from the AGN/Liner (red points) regions. The solid lines further distinguish between AGN ionization (above the line) and LINER ionization (below). The corresponding spatial distribution of starburst/non-starburst 3×3 binned spaxels are shown on the corresponding plots of the lower panel. The field of view of the plots of the lower panel is the same as in Fig. 3. The highest fraction of spaxels inconsistent with a photoionization by a starburst show up on the [OIII]/Hβ vs. [OI]/Hα diagram. Their spectra have been stacked, and the resulting extracted line ratios are shown with the black point, together with the error bar.
Current usage metrics show cumulative count of Article Views (full-text article views including HTML views, PDF and ePub downloads, according to the available data) and Abstracts Views on Vision4Press platform.
Data correspond to usage on the plateform after 2015. The current usage metrics is available 48-96 hours after online publication and is updated daily on week days.
Initial download of the metrics may take a while.