Fig. 6
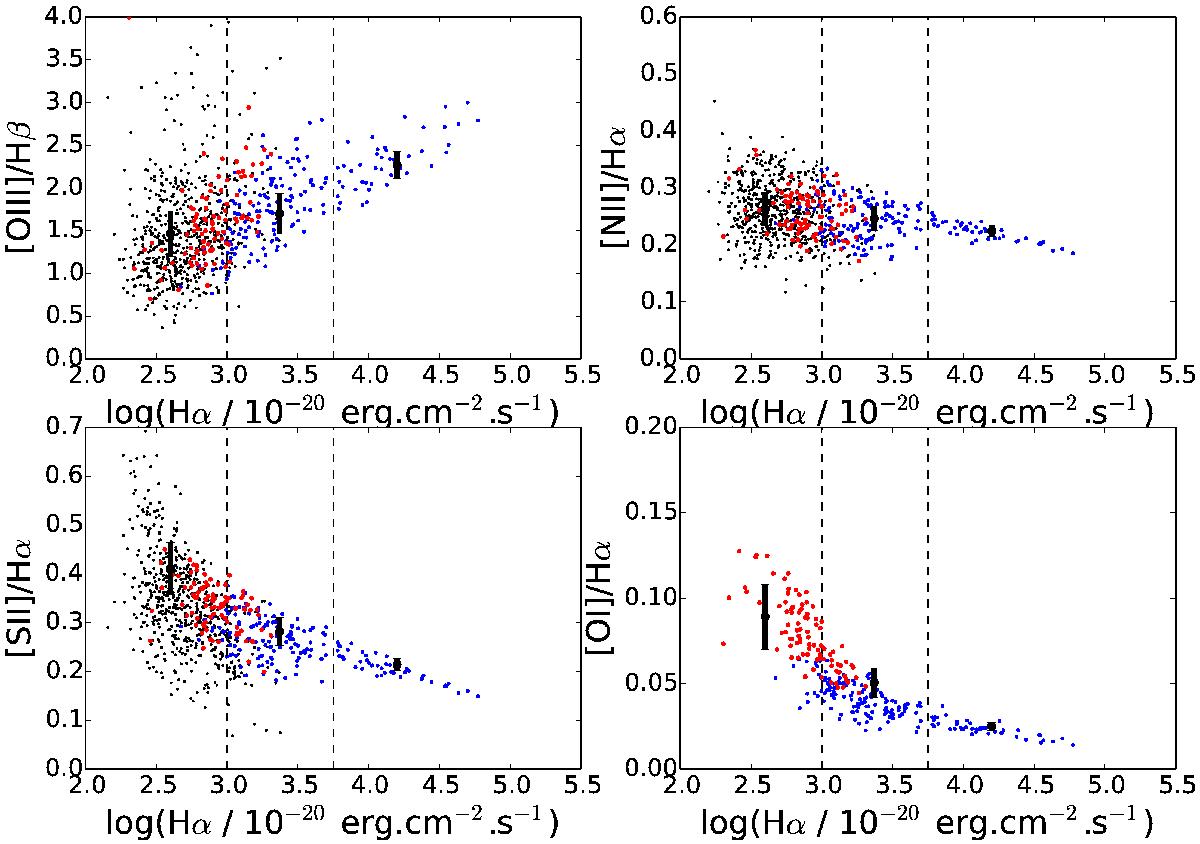
Distribution of emission-line ratios as a function of the Hα flux, also tracing the local Hα flux surface brightness. The blue, resp. red, points correspond to those located inside, resp. outside, the starburst locus in the [OI]/Hα BPT diagnostic diagram (see Fig. 7). The small black points correspond to spaxels with an undetected [OI] line. The error bars are 1σ typical dispersion, and their y-axis position is the mean value of the ratio in the given Hα flux range.
Current usage metrics show cumulative count of Article Views (full-text article views including HTML views, PDF and ePub downloads, according to the available data) and Abstracts Views on Vision4Press platform.
Data correspond to usage on the plateform after 2015. The current usage metrics is available 48-96 hours after online publication and is updated daily on week days.
Initial download of the metrics may take a while.